Are you a member of the Splunk Community?
- Find Answers
- :
- Using Splunk
- :
- Splunk Search
- :
- Time chart events per index per month but only fir...
- Subscribe to RSS Feed
- Mark Topic as New
- Mark Topic as Read
- Float this Topic for Current User
- Bookmark Topic
- Subscribe to Topic
- Mute Topic
- Printer Friendly Page
- Mark as New
- Bookmark Message
- Subscribe to Message
- Mute Message
- Subscribe to RSS Feed
- Permalink
- Report Inappropriate Content
Time chart events per index per month but only first n events per month
| metasearch index="l-hhvm" OR index="l-nginx"
| timechart count as event span=1month by index
| eventstats max(event) as event_count by _time index
I want to get a time based understanding of when these indices have event data, over all time. But, there is way too many events to count all the way up to the total per month. I would be happy to just count to 10000 and move on to the next month.
Ideally, count for each month, for each index, up to 10000 (to represent significant data present) all time (could be up to two years).
Sampling won't work becuase there are too many events, it would still take too much time.
- Mark as New
- Bookmark Message
- Subscribe to Message
- Mute Message
- Subscribe to RSS Feed
- Permalink
- Report Inappropriate Content
There is a technical answer to this, and there is a viability answer to this.
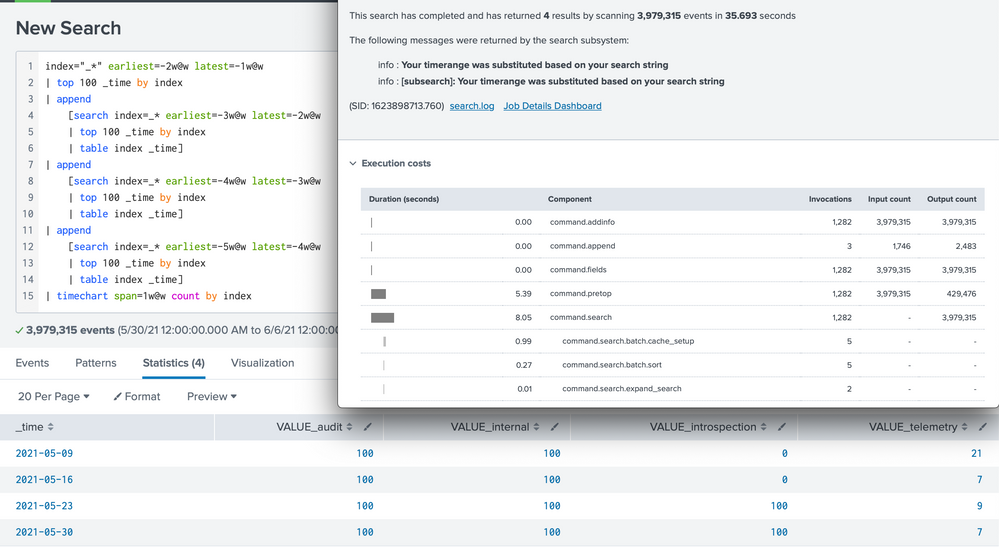
The technical answer is to limit your search to one month, then use append to add events for additional months, run a top in each search and subsearch, like so
index="_*" earliest=-2w@w latest=-1w@w
| top 100 _time by index
| append
    [search index=_* earliest=-3w@w latest=-2w@w
    | top 100 _time by index
    | table index _time]
| append
    [search index=_* earliest=-4w@w latest=-3w@w
    | top 100 _time by index
    | table index _time]
| append
    [search index=_* earliest=-5w@w latest=-4w@w
    | top 100 _time by index
    | table index _time]
| timechart span=1w@w count by index
(Instead of month, I use week to speed up testing.). It gives me something like
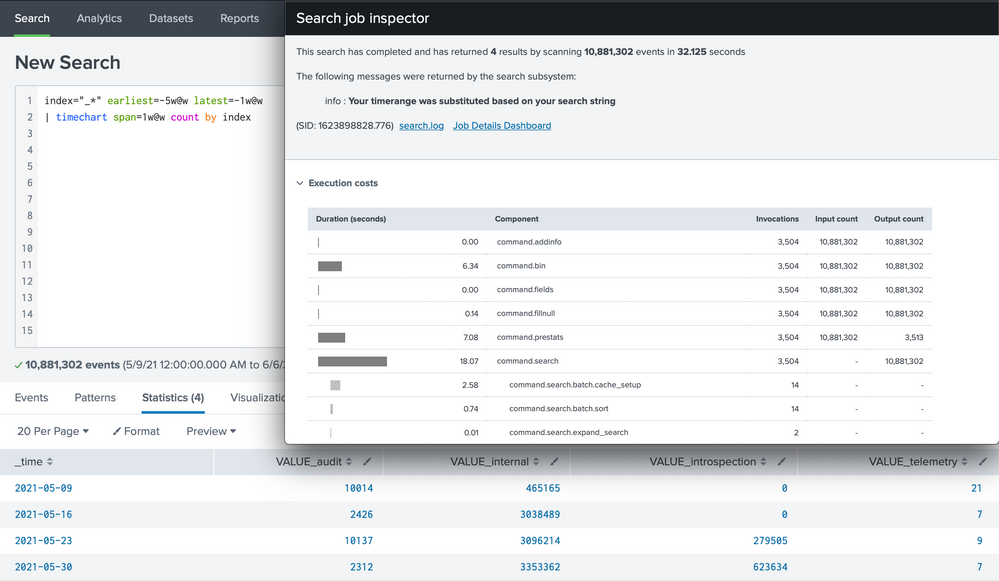
The results can be validated by running a simple timechart, i.e.,
index="_*" earliest=-5w@w latest=-1w@w
| timechart span=1w@w count by index
Does full append-top achieve the goal of saving counts? The answer is no. All records for each week (month in your case) are still streamed back. All the subsearches add overhead. As a result, append-top uses 35.7s, compared to simple timechart's 32.1s.
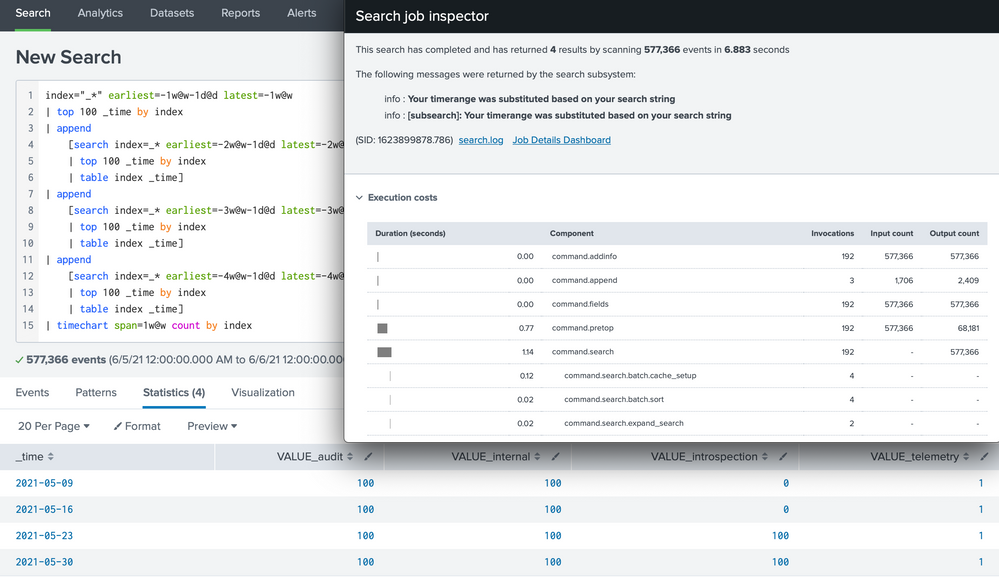
So, here is an alternative that will be valid ONLY if your event rate is relatively stable over the sampling period:
index="_*" earliest=-1w@w-1d@d latest=-1w@w
| top 100 _time by index
| append
    [search index=_* earliest=-2w@w-1d@d latest=-2w@w
    | top 100 _time by index
    | table index _time]
| append
    [search index=_* earliest=-3w@w-1d@d latest=-3w@w
    | top 100 _time by index
    | table index _time]
| append
    [search index=_* earliest=-4w@w-1d@d latest=-4w@w
    | top 100 _time by index
    | table index _time]
| timechart span=1w@w count by index
In this method, only the last day of the week is counted.
This search uses 6.9s. Is this the best solution? Not really. It is not only clumsy to setup, but it does rely on a pretty arbitrary assumption about data.
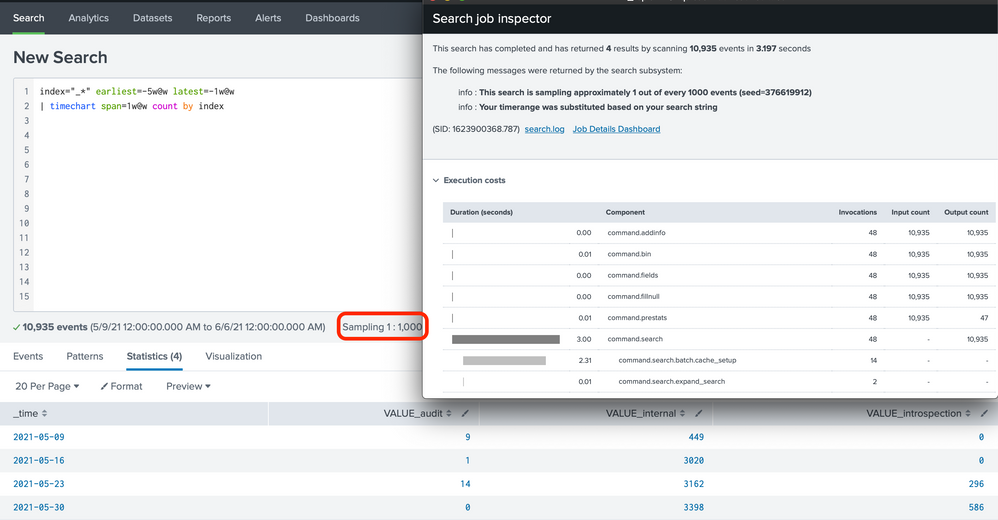
I am not sure why sampling won't work for you, unless your purpose is to accurately count those less populous events.
If I only want a relative comparison, this serves the purpose and finishes in mere 3.2s. You can use even looser sampling.


