Are you a member of the Splunk Community?
- Find Answers
- :
- Using Splunk
- :
- Splunk Search
- :
- Re: The maximum number of concurrent historical se...
- Subscribe to RSS Feed
- Mark Topic as New
- Mark Topic as Read
- Float this Topic for Current User
- Bookmark Topic
- Subscribe to Topic
- Mute Topic
- Printer Friendly Page
- Mark as New
- Bookmark Message
- Subscribe to Message
- Mute Message
- Subscribe to RSS Feed
- Permalink
- Report Inappropriate Content
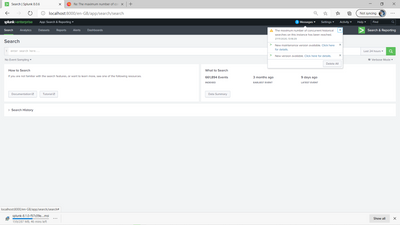
Hello, I am stuck, this error message keeps appearing, so I cannot run any searches, they just get queued up.
It has rendered my Splunk instance as unusable?
I was thinking I may have too many searches running in the background due to tutorial zip files loaded? I cannot delete the tutorial files as cannot run any searches?
And does this also stop me from seeing csv and zip files I have recently successfully uploaded, as I cannot see them??
Any help would be great, thanks a lot.
- Mark as New
- Bookmark Message
- Subscribe to Message
- Mute Message
- Subscribe to RSS Feed
- Permalink
- Report Inappropriate Content
- Mark as New
- Bookmark Message
- Subscribe to Message
- Mute Message
- Subscribe to RSS Feed
- Permalink
- Report Inappropriate Content
Basically you should see those via MC - Search - Scheduler.
r. Ismo
- Mark as New
- Bookmark Message
- Subscribe to Message
- Mute Message
- Subscribe to RSS Feed
- Permalink
- Report Inappropriate Content
Hi, @isoutamo @impurush I cannot even run my monitoring console as the reports are all being queued.
But I cannot see any alerts in searches reports and alerts, and I also don't have an Administrator button.
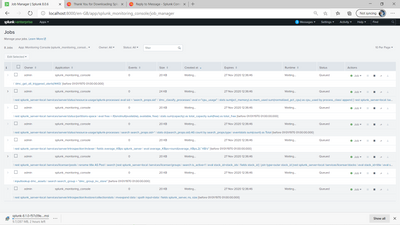
I have attached a screenshot of the reports that are being run. I deleted these yesterday but they are back up and running today, very confusing as I am not running them.
Thanks a lot for your help.
- Mark as New
- Bookmark Message
- Subscribe to Message
- Mute Message
- Subscribe to RSS Feed
- Permalink
- Report Inappropriate Content
Please change app to All from MC when you are looking which job there are running. Also owner etc. should be All.
- Mark as New
- Bookmark Message
- Subscribe to Message
- Mute Message
- Subscribe to RSS Feed
- Permalink
- Report Inappropriate Content
Hi @isoutamo I have selected all the reports in activity and have stopped all of them, but when I return to search app the error occurs again and all the reports show up again. So effectively I cannot use my Splunk instance. Does it need a re-install? Thanks.
- Mark as New
- Bookmark Message
- Subscribe to Message
- Mute Message
- Subscribe to RSS Feed
- Permalink
- Report Inappropriate Content
- Mark as New
- Bookmark Message
- Subscribe to Message
- Mute Message
- Subscribe to RSS Feed
- Permalink
- Report Inappropriate Content
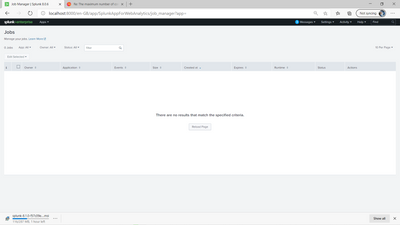
Hi @isoutamo here is a screenshot of all selected, no jobs running, but when I go to the search and reporting app the error message occurs again.
- Mark as New
- Bookmark Message
- Subscribe to Message
- Mute Message
- Subscribe to RSS Feed
- Permalink
- Report Inappropriate Content
- Mark as New
- Bookmark Message
- Subscribe to Message
- Mute Message
- Subscribe to RSS Feed
- Permalink
- Report Inappropriate Content
- Mark as New
- Bookmark Message
- Subscribe to Message
- Mute Message
- Subscribe to RSS Feed
- Permalink
- Report Inappropriate Content
Hi @isoutamo , thanks, @impurush thanks too, I have updated my Splunk install, and error message is not showing anymore, so great thanks for your help. My search capability is back which is great.
Also now I am having trouble adding any csv data or zip data, I am only seeing csv files by adding by lookup,
when I add the file in ADD DATA the file uploads successfully but I cannot see it?
Thanks a lot for any help.
- Mark as New
- Bookmark Message
- Subscribe to Message
- Mute Message
- Subscribe to RSS Feed
- Permalink
- Report Inappropriate Content
Hi @roderick001 ,
You can see the job/search status under the Activity->Jobs tab and see what is running, then you can take necessary action whether to stop/pause.
Which Splunk version are you using? If you are installed or updated recently to 8.0.x version and if you are not able to view the lookup page, then one of your dashboard is without a title. This is a known issue.
- Mark as New
- Bookmark Message
- Subscribe to Message
- Mute Message
- Subscribe to RSS Feed
- Permalink
- Report Inappropriate Content
Hi, thanks, checked Activity jobs, I am logged in as Admin and not my username, as Admin there are quite a few searches going on which I am not running.
I am running Splunk 8.0.6 Enterprise free, and I cannot see the login or logout button, how do I log out and run Splunk with my username, it keeps booting up as Admin?
Thanks for your help.
- Mark as New
- Bookmark Message
- Subscribe to Message
- Mute Message
- Subscribe to RSS Feed
- Permalink
- Report Inappropriate Content
@roderick001 If you can paste the screenshot of what type of jobs you are running, that will be helpful.
Hope the Splunk is running by you alone or your team?
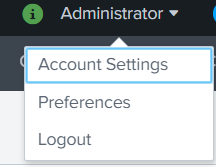
By the way, the logout option will be under your username(Admin).


