Join the Conversation
- Find Answers
- :
- Using Splunk
- :
- Splunk Search
- :
- Splunk dashboard single value trendinterval time a...
- Subscribe to RSS Feed
- Mark Topic as New
- Mark Topic as Read
- Float this Topic for Current User
- Bookmark Topic
- Subscribe to Topic
- Mute Topic
- Printer Friendly Page
- Mark as New
- Bookmark Message
- Subscribe to Message
- Mute Message
- Subscribe to RSS Feed
- Permalink
- Report Inappropriate Content
Splunk dashboard single value trendinterval time as dynamic
Hello,
I' m currently working on how to make dashboard with our Server's VM Count logs.
Our logs are being collected as daily basis, I'm trying to show the count trend using trellis by data center.
The command are like below.
host=[HOST] index=[INDEX] sourcetype=[SRC_TYPE] source=[SRC]
| timechart limit=0 span=1d sum(vm.count) as VM by center
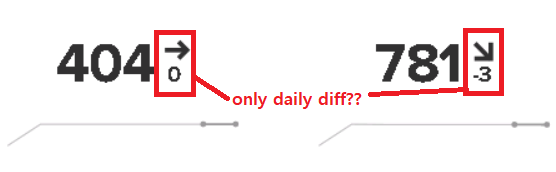
If I make single value trellis viz with above command, I found the difference of VM count is only shown as daily basis. Like the pic attached.
I want to make trendinterval option value to dynamically change if I click time picker to change time range.
Like, If I change time range to Last 90days, then showing me the difference between today and 90days ago.
How could I make it so?
Thank you.
- Mark as New
- Bookmark Message
- Subscribe to Message
- Mute Message
- Subscribe to RSS Feed
- Permalink
- Report Inappropriate Content
Here's an example that works for me:
index=_internal sourcetype=splunkd source=*/splunkd.log* earliest=-90d
| timechart limit=0 span=1d useother=f count by component


By default, it compares the two most recent values (today and yesterday). Is your "Compared to" option set correctly?


Join the Splunk Community Slack to learn, troubleshoot, and make connections with fellow Splunk practitioners in real time!
Join Splunk User Groups to connect and learn in-person by region or remotely by topic or industry.
Best Practices: Splunk auto adjust pipeline queue
Laser Bananas and Edge Hubs: Exploring Operational Technology (OT) Data Through a ...
Event Series: Mastering AI Tokenomics and Splunk Agent Observability
