
Join the Conversation
- Find Answers
- :
- Using Splunk
- :
- Splunk Search
- :
- Re: Splunk Statistics table with totals column
- Subscribe to RSS Feed
- Mark Topic as New
- Mark Topic as Read
- Float this Topic for Current User
- Bookmark Topic
- Subscribe to Topic
- Mute Topic
- Printer Friendly Page
- Mark as New
- Bookmark Message
- Subscribe to Message
- Mute Message
- Subscribe to RSS Feed
- Permalink
- Report Inappropriate Content

Below is my CSV Data :
Company, Model,Year
Honda, Civic, 2016
Toyota, Camry, 2017
Honda, Accord, 2016
Honda, Civic SE,2017
Honda, Fit, 2017
Honda, Fit EV, 2017
Toyota, Corolla, 2016
Toyota, Yaris, 2017
The fields auto extracted by splunk are Company,Model and Year.
When i make a "chart count over Company by Year | addtotals " and change to statistics table in Splunk simple xml Dashboard visualizations,i get the result as
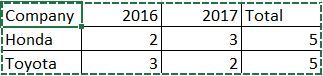
My requirement is to get the totals field as second column.
Expected:
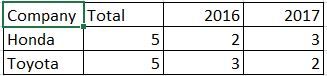
IF not possible through the above way,kindly suggest a way to achieve the expected stats table,with total field as second column.
Thanks in Advance
- Mark as New
- Bookmark Message
- Subscribe to Message
- Mute Message
- Subscribe to RSS Feed
- Permalink
- Report Inappropriate Content


Try this: chart count over Company by Year | addtotals | fields Company, Total, *
- Mark as New
- Bookmark Message
- Subscribe to Message
- Mute Message
- Subscribe to RSS Feed
- Permalink
- Report Inappropriate Content
Try this: chart count over Company by Year | addtotals | fields Company, Total, *
- Mark as New
- Bookmark Message
- Subscribe to Message
- Mute Message
- Subscribe to RSS Feed
- Permalink
- Report Inappropriate Content
Worked like a charm....
Thanks Ssievert




Join the Splunk Community Slack to learn, troubleshoot, and make connections with fellow Splunk practitioners in real time!
Join Splunk User Groups to connect and learn in-person by region or remotely by topic or industry.
Meet the .conf26 AI Agent Buildathon Winners
Trusted Autonomy in the SOC: A Maturity Journey
Supercharging Windows Security Detection Performance: Introducing Hybrid Field ...
