Are you a member of the Splunk Community?
- Find Answers
- :
- Using Splunk
- :
- Splunk Search
- :
- Re: Splunk - Stat count return wrong values
- Subscribe to RSS Feed
- Mark Topic as New
- Mark Topic as Read
- Float this Topic for Current User
- Bookmark Topic
- Subscribe to Topic
- Mute Topic
- Printer Friendly Page
- Mark as New
- Bookmark Message
- Subscribe to Message
- Mute Message
- Subscribe to RSS Feed
- Permalink
- Report Inappropriate Content
Hi,
I am totally puzzled.
I have two (unrelated) Splunk installations with SAME index and event structure (... everything).
- One platform (installed on private linux host) returns perfectly coherent Search Stat "counts"
- The other platform (on a AWS EC2) returns WRONG counts (like x2, x4 depending on the grouping criteria).
SCENARIO:
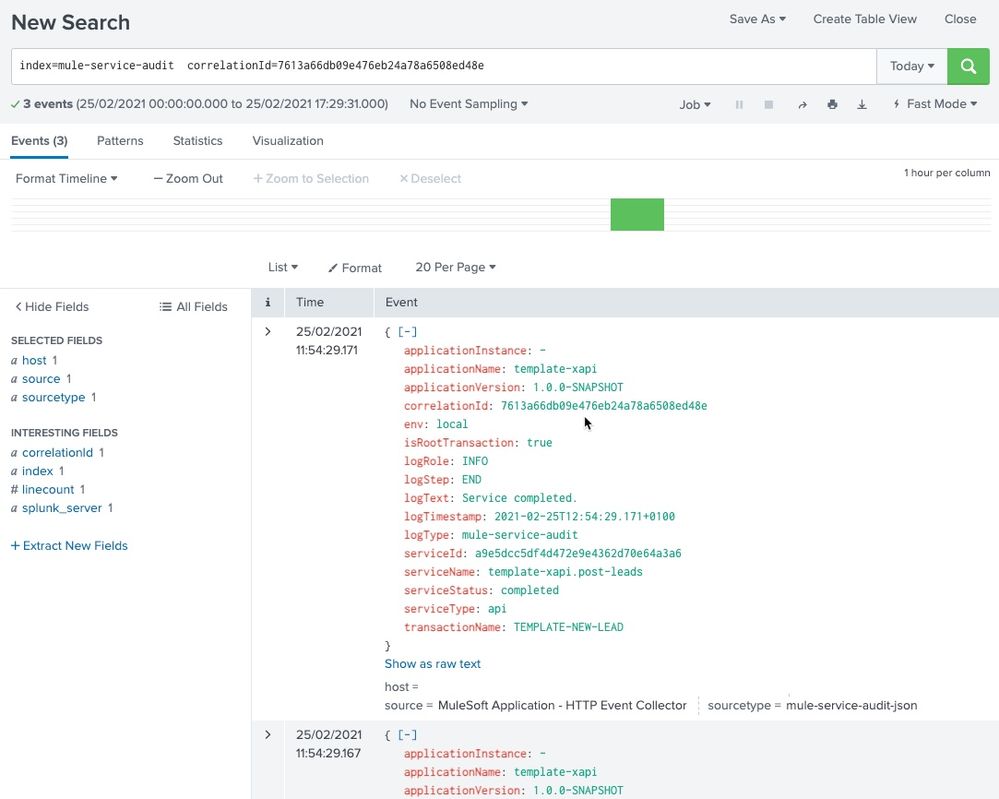
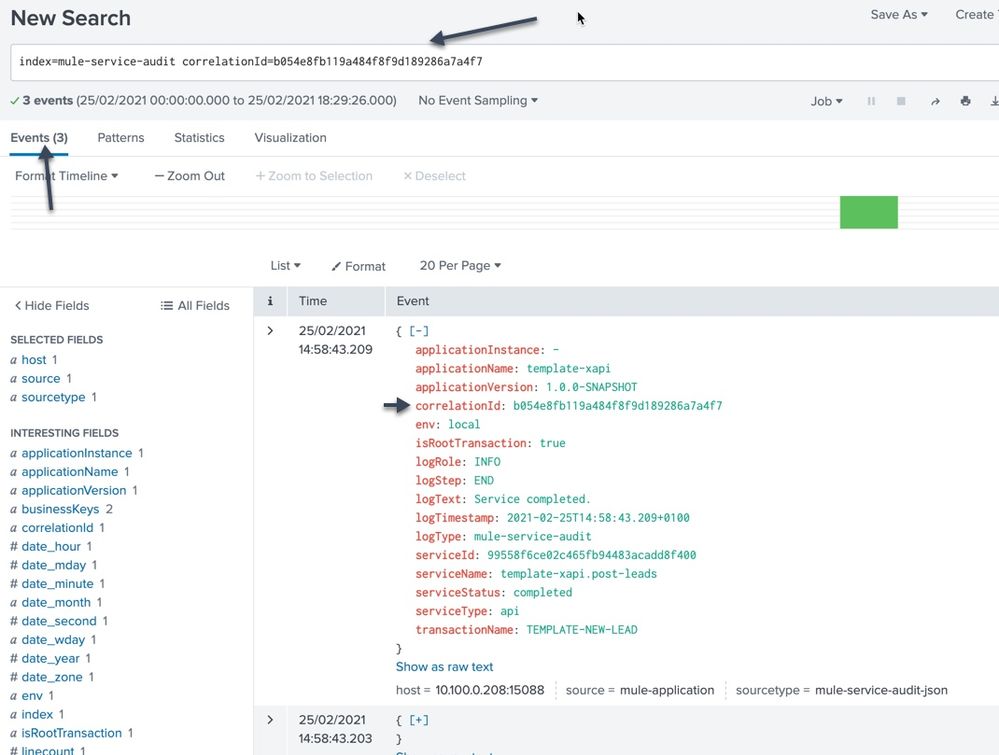
- I send 3 JSON events. Each event has one "correlationId" top-level JSON field with the same value. So filtering on that corelationId = xxx does return 3 perfectly coherent events (on both platforms).
See "base-search-local-OK.jpg", "base-search-aws-OK.jpg" attachments.
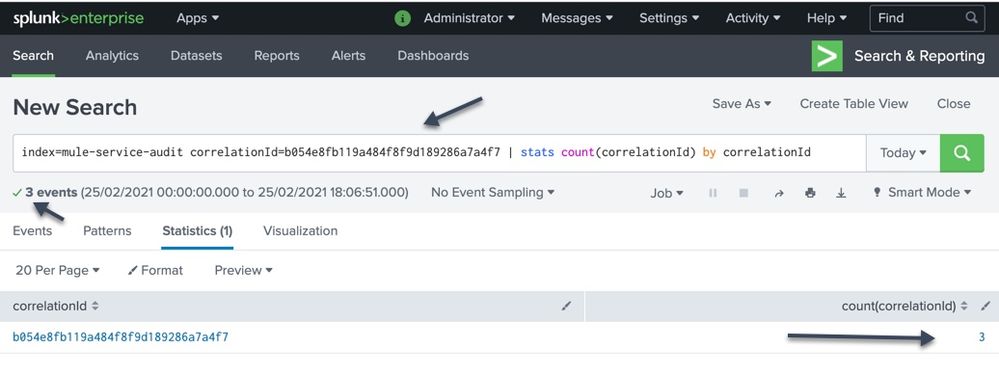
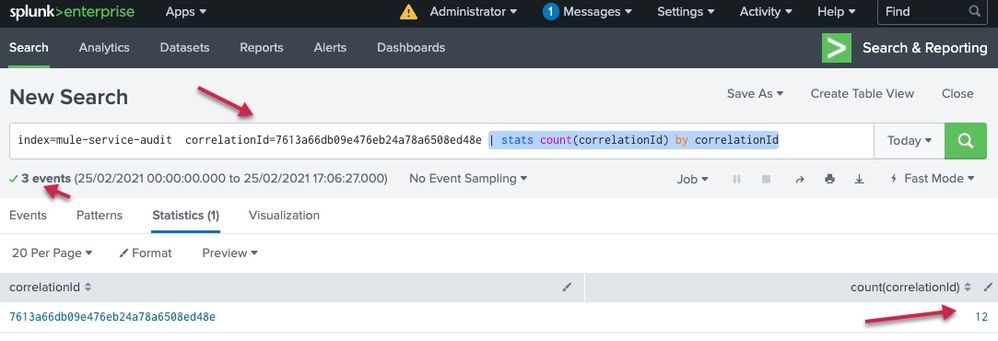
- Then i run a Search "Stat" with a count grouped by correlationId. The result on the AWS platform is very WRONG by a factor of 4 (it returns 12 instead of 3!!!). See stat-search-local-OK.jpg, stat-search-aws-WRONG.jpg.
While i am not an expert at Splunk, i have investigated for hours without understanding the root cause. I am a more advanced ELK user, but never experienced such puzzling questions.
==> There has to be something related to the difference with the platforms HOSTS. Why is Splunk on AWS host result so different to my local linux install. Can this be related to the network configuration?... no clue.
Thanks a lot if that rings a bell to you.
kind regards.
-Florent.
- Mark as New
- Bookmark Message
- Subscribe to Message
- Mute Message
- Subscribe to RSS Feed
- Permalink
- Report Inappropriate Content
I notice this is mulesoft in json, and in one instance you have the HEC sourcetype, and in another, its just the application name. In the props.conf for extraction, ensure you have KV_MODE=json, or it may take things line by line. Similar to this:
TRUNCATE = 0
LINE_BREAKER = ([\r\n]+)
SHOULD_LINEMERGE = false
INDEXED_EXTRACTIONS = JSON
KV_MODE = JSON
When sending to HEC, you can specify the payload as an event or raw, one of while will get parsed. See here: https://docs.splunk.com/Documentation/Splunk/8.1.2/Data/FormateventsforHTTPEventCollector#Event_pars...
I suspect, you are doube parsing one and not the other, as they seem to be coming in from different sources.
- Mark as New
- Bookmark Message
- Subscribe to Message
- Mute Message
- Subscribe to RSS Feed
- Permalink
- Report Inappropriate Content
Jschogel,
Thank you for your response: this is the right direction!
Note: the two "source types" have been designed "manually" in each Splunk install/instances and the names/description as you have well seen in the event are effectively different, but this is just naming difference. The *intent* was to have exact same settings.
Upon investigations, i can see a difference in the "/etc/system/local/props.conf" file.
### Instance with WRONG Counts:
[mule-service-audit-json]
DATETIME_CONFIG =
INDEXED_EXTRACTIONS = json
LINE_BREAKER = ([\r\n]+)
NO_BINARY_CHECK = true
TIMESTAMP_FIELDS = logTimestamp
category = Structured
description = Mule application logging service audit
pulldown_type = 1
disabled = false
### Instance with RIGHT Counts:
[mule-service-audit-json]
DATETIME_CONFIG =
INDEXED_EXTRACTIONS = json
KV_MODE = none
LINE_BREAKER = ([\r\n]+)
NO_BINARY_CHECK = true
TIMESTAMP_FIELDS = logTimestamp
category = Structured
description = Mule application logging service audit
disabled = false
pulldown_type = 1
The only difference is the explicit mention of "KV_MODE = none" in the instance RIGHT config.
I have upgraded the instance with WRONG stat counts with this additional property in the prop.conf, and the counts are now CORRECT.
Special thx to you.
I am not sure how i introduced this difference while manually creating the source type configuration. I may have clicked on some Advanced setting by mistake and delete the KV_MODE=non property.
I understand that IF KV_MODE is not set, then Splunk will assume a value of "AUTO", with an automated detection of KV expressions. This triggered the multiple extractions.
I also understand that "KV_MODE=json" should not be put TOGETHER with "INDEXED_EXTRACTIONS = json", as it could result in duplicate extraction.
So i have left the KV_MODE=none.
Thank you very much and kind regards.
-Florent.
- Mark as New
- Bookmark Message
- Subscribe to Message
- Mute Message
- Subscribe to RSS Feed
- Permalink
- Report Inappropriate Content
Are the indexers standalone or clustered?
The difference in your results sounds like what occurs when you connect to indexer cluster members as directly as peers rather than as a cluster member with the search head role. You'll receive N*RF events, where N is the number of distinct matching events and RF is the cluster's replication factor.
- Mark as New
- Bookmark Message
- Subscribe to Message
- Mute Message
- Subscribe to RSS Feed
- Permalink
- Report Inappropriate Content
hi tscroggins, thx - but there is no cluster setup. Just a single basic Splunk unzip/run.
kind regards.
-Florent.
- Mark as New
- Bookmark Message
- Subscribe to Message
- Mute Message
- Subscribe to RSS Feed
- Permalink
- Report Inappropriate Content
Attachments.


- Mark as New
- Bookmark Message
- Subscribe to Message
- Mute Message
- Subscribe to RSS Feed
- Permalink
- Report Inappropriate Content
Part of the investigations, i copied the whole splunk install (tar archive /opt/splunk) from the working machine to the AWS host. The copied Splunk install on AWS shows correct counts, similar to the original local host.
So there has to be a difference in the setup. I cannot figure out what difference exist between the working setup and the wrong one. I have tried re-install and configure splunk "from scratch" on the AWS host at least 3 times, and stat counts were never right.
Q: What factors can explain that a search like:
index=mule-service-audit correlationId=7613a66db09e476eb24a78a6508ed48e | stats count(correlationId) by correlationId
Returns a count of "12" while there are ONLY 3 events with such a correlationId value?
Every event introspection shows there are only 3 such events. Just the Stat Count is WRONG.
Thank you if you can help troubleshoot this behaviour.
Kind regards.
-Florent.
- Mark as New
- Bookmark Message
- Subscribe to Message
- Mute Message
- Subscribe to RSS Feed
- Permalink
- Report Inappropriate Content
Have you tried
| stats count by correlationId- Mark as New
- Bookmark Message
- Subscribe to Message
- Mute Message
- Subscribe to RSS Feed
- Permalink
- Report Inappropriate Content
Hello ITWhisperer,
For 3 Events with same correlationId:
"| stats count(correlationId) by correlationId" returns a count of 12
"| stats count by correlationId" returns a count of 6
This is still twice what is expected.
Thank you.
- Mark as New
- Bookmark Message
- Subscribe to Message
- Mute Message
- Subscribe to RSS Feed
- Permalink
- Report Inappropriate Content
Do you have multivalue fields because these can generate counts greater than number of events?
| makeresults | eval _raw="correlationId
7613a66db09e476eb24a78a6508ed48e
7613a66db09e476eb24a78a6508ed48e,7613a66db09e476eb24a78a6508ed48e
7613a66db09e476eb24a78a6508ed48e,7613a66db09e476eb24a78a6508ed48e,7613a66db09e476eb24a78a6508ed48e"
| multikv forceheader=1
| eval correlationId=split(correlationId,",")
| stats count by correlationId