
Join the Conversation
- Find Answers
- :
- Using Splunk
- :
- Splunk Search
- :
- Show an area under a chart
- Subscribe to RSS Feed
- Mark Topic as New
- Mark Topic as Read
- Float this Topic for Current User
- Bookmark Topic
- Subscribe to Topic
- Mute Topic
- Printer Friendly Page
- Mark as New
- Bookmark Message
- Subscribe to Message
- Mute Message
- Subscribe to RSS Feed
- Permalink
- Report Inappropriate Content
Show an area under a chart

I have a line chart and have to calculate area under this chart. The calculated area must be presented on a chart panel or on the chart itself. How can I fo it? I realise that the line is merely set of points tiered together. But it's really must have task for me
- Mark as New
- Bookmark Message
- Subscribe to Message
- Mute Message
- Subscribe to RSS Feed
- Permalink
- Report Inappropriate Content


It sounds like you are looking to calculate a definite integral to get the line under a graph. Excel has a similar issue, and the solution here would be similar. Approximate the area underneath the line by creating a series of trapezoids, and calculate the area in each of those trapezoids, then add them altogether. The smaller the width of the trapezoids, the more accurate the estimation will be.
The area of a trapezoid is calculated as: (Sum of 2 vertical sides) / 2 x (Base of trapezoid)
This metric has no units per se, because you aren't dealing with a definitive unit like inches. So when you use this formula, you need to define your units for length of the sides and the base, and keep them consistent every time you use it.
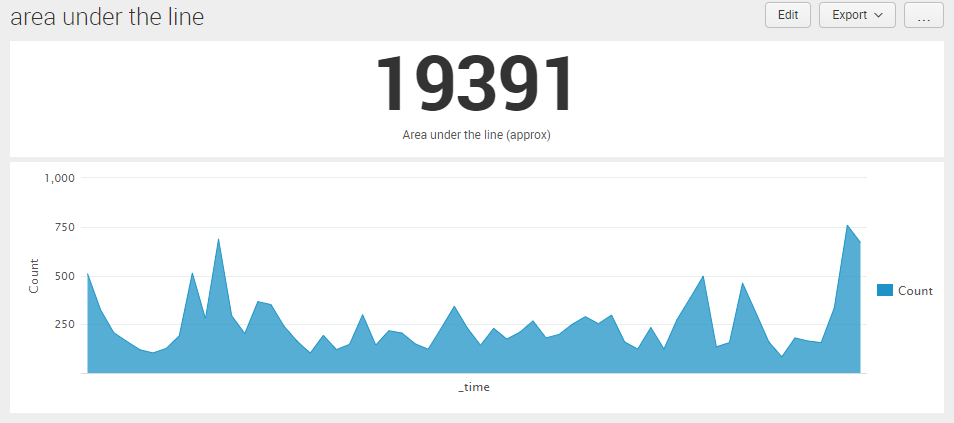
In the run anywhere example dashboard below, I've used 1 second for the base. YMMV due to the size of your data events. I might recommend a dashboard with one query that gets you the line chart visualization in one panel and a separate query that gets you the area as a single value visualization in another panel.
Visualized:
Here's the dashboard code:
 <dashboard>
      <label>area under the line</label>
      <row>
        <panel>
          <single>
            <search>
              <query>index=_internal sourcetype="*d_access" OR sourcetype="*d_ui_access" OR sourcetype="*k_web_access" earliest="-1m@m" latest="@m"
    | bucket _time span=1s
    | stats count AS "Count" BY _time
    | eval baseoftrapezoid=1
    | eval twoxbaseoftrapezoid=2*baseoftrapezoid
    | autoregress Count p=1
    | eval vericalsideone=Count
    | eval vericalsidetwo=Count_p1
    | eval area=(vericalsideone + vericalsidetwo) / twoxbaseoftrapezoid
    | eventstats sum(area) AS "TotalArea"
    | table TotalArea</query>
              <earliest>-24h@h</earliest>
              <latest>now</latest>
            </search>
            <option name="drilldown">none</option>
            <option name="underLabel">Area under the line (approx)</option>
            <option name="useThousandSeparators">0</option>
          </single>
        </panel>
      </row>
      <row>
        <panel>
          <chart>
            <search>
              <query>index=_internal sourcetype="*d_access" OR sourcetype="*d_ui_access" OR sourcetype="*k_web_access" earliest="-1m@m" latest="@m"
    | bucket _time span=1s
    | stats count AS "Count" BY _time</query>
              <earliest>-24h@h</earliest>
              <latest>now</latest>
            </search>
            <option name="charting.chart">area</option>
            <option name="charting.drilldown">none</option>
          </chart>
        </panel>
      </row>
    </dashboard>
If this reply helps you, an upvote would be appreciated.
- Mark as New
- Bookmark Message
- Subscribe to Message
- Mute Message
- Subscribe to RSS Feed
- Permalink
- Report Inappropriate Content

What do you mean by calculating area under the line chart? Could you provide some example (with values) of what you expect?
- Mark as New
- Bookmark Message
- Subscribe to Message
- Mute Message
- Subscribe to RSS Feed
- Permalink
- Report Inappropriate Content
I want to calculate an area of the red shape area. Please find attached an example: https://yadi.sk/i/stejtyVF8T06CA



Join the Splunk Community Slack to learn, troubleshoot, and make connections with fellow Splunk practitioners in real time!
Join Splunk User Groups to connect and learn in-person by region or remotely by topic or industry.
A Four-Part Event Series: Full Stack Observability For the AI Era
SOC4Kafka - New Kafka Connector Powered by OpenTelemetry
Event Series: Level up your SOC: Advancing with Splunk Enterprise Security
