Turn on suggestions
Auto-suggest helps you quickly narrow down your search results by suggesting possible matches as you type.
Splunk Search
×
Are you a member of the Splunk Community?
Sign in or Register with your Splunk account to get your questions answered, access valuable resources and connect with experts!
Turn on suggestions
Auto-suggest helps you quickly narrow down your search results by suggesting possible matches as you type.
- Find Answers
- :
- Using Splunk
- :
- Splunk Search
- :
- Re: Search by time, then visualize in
Options
- Subscribe to RSS Feed
- Mark Topic as New
- Mark Topic as Read
- Float this Topic for Current User
- Bookmark Topic
- Subscribe to Topic
- Mute Topic
- Printer Friendly Page
- Mark as New
- Bookmark Message
- Subscribe to Message
- Mute Message
- Subscribe to RSS Feed
- Permalink
- Report Inappropriate Content
moayadalghamdi
Path Finder
01-27-2021
10:28 PM
Hello Splunkers !
i want to write a command that shows a timeline of authentication activities as following:
index=MyIndex eventtype=Authentication user=* action=* src=* | stats count(user) by _time
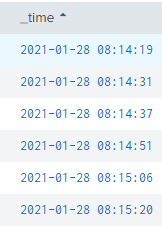
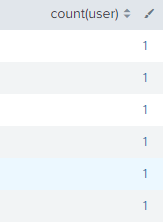
the output looks like this:
the thing is that the time is in seconds is shown is statistics below:
i want the the command to show count for authentication attempts by minutes not seconds.
Thanks ^_^
1 Solution
- Mark as New
- Bookmark Message
- Subscribe to Message
- Mute Message
- Subscribe to RSS Feed
- Permalink
- Report Inappropriate Content
bowesmana

SplunkTrust
01-27-2021
10:43 PM
index=MyIndex eventtype=Authentication user=* action=* src=*
| bin _time span=1m
| stats count(user) by _time
OR
index=MyIndex eventtype=Authentication user=* action=* src=*
| timechart span=1m count(user)
- Mark as New
- Bookmark Message
- Subscribe to Message
- Mute Message
- Subscribe to RSS Feed
- Permalink
- Report Inappropriate Content
bowesmana

SplunkTrust
01-27-2021
10:43 PM
index=MyIndex eventtype=Authentication user=* action=* src=*
| bin _time span=1m
| stats count(user) by _time
OR
index=MyIndex eventtype=Authentication user=* action=* src=*
| timechart span=1m count(user)
- Mark as New
- Bookmark Message
- Subscribe to Message
- Mute Message
- Subscribe to RSS Feed
- Permalink
- Report Inappropriate Content
moayadalghamdi
Path Finder
01-27-2021
11:50 PM
AWESOME !, Thanks ^_^
Get Updates on the Splunk Community!
Automatic Discovery Part 1: What is Automatic Discovery in Splunk Observability Cloud ...
If you’ve ever deployed a new database cluster, spun up a caching layer, or added a load balancer, you know it ...
Real-Time Fraud Detection: How Splunk Dashboards Protect Financial Institutions
Financial fraud isn't slowing down. If anything, it's getting more sophisticated. Account takeovers, credit ...
Splunk + ThousandEyes: Correlate frontend, app, and network data to troubleshoot ...
Are you tired of troubleshooting delays caused by siloed frontend, application, and network data? We've got a ...


