- Find Answers
- :
- Using Splunk
- :
- Splunk Search
- :
- Report with percentages and counts per month
- Subscribe to RSS Feed
- Mark Topic as New
- Mark Topic as Read
- Float this Topic for Current User
- Bookmark Topic
- Subscribe to Topic
- Mute Topic
- Printer Friendly Page
- Mark as New
- Bookmark Message
- Subscribe to Message
- Mute Message
- Subscribe to RSS Feed
- Permalink
- Report Inappropriate Content
I did a search of the last 3 months on fields A = "xxx" and B = "yyy" and it has to return me 2 other fields, C and D, which contain dates.
I would like to make a total count (total_count) on field C divided by month.
Now another filter where the difference (diff_day) between the 2 dates, C and D, is less than 45 days and count how many events there are (count_event) always divided by month and finally find the percentage for each month.
the table must have me:
total_count per month,
count_event per month
count_event / total_count ie the percentage for each month.
My query:
index="04_analisi"
| where CANALE="DIRECT" AND TIPO="ATTIVE"
|dedup LINK,ID
|eventstats count(DATA_OUT) AS total_count
|sort DATA_OUT
|eval dataout=strptime(DATA_OUT,"%Y-%m-%d")
| eval datakpi=strptime(DATA_KPI,"%Y-%m-%d")
| eval diff_day=round((datakpi - dataout)/86400,0)
| where diff_day <= 45
|eventstats count(DATA_OUT) AS count_event
|eval perc=round((count_event/total_count)*100,2)
|eval Month=strftime(strptime(DATA_OUT,"%Y/%m/%d %H:%M"),"%b")
| timechart span=1mon count(DATA_OUT)
I have tried with timechart but it is not what I want.
Any suggestions?
I'm trying them all, reading the various questions and answers here on the community.
I would like to try to better understand where I am wrong.
Tks
Bye
Antonio
- Mark as New
- Bookmark Message
- Subscribe to Message
- Mute Message
- Subscribe to RSS Feed
- Permalink
- Report Inappropriate Content
Excellent, with that data, I ... well, we'll see if this is *right* or not, but at least it's gonna be way closer.
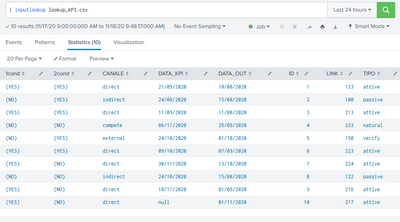
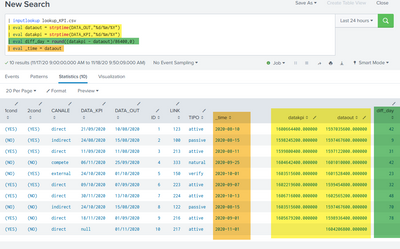
I converted your data into a CSV file and uploaded to my system so I have a thing I can use with `| inputlookup` (I'll paste all code later, after the screenshots so you can copy/paste it if needed).
I had to fiddle a little with the date formats (not worth my effort to figure why), but then I got the new fields created. In addition, I assigned the field `_time` to dataout, perhaps that should be set to datakpi instead. Either way, that's left as an exercise for the reader. Also my fields are differently named, I'm sure you'll figure that part out and correct as you want. 🙂
If you are color blind, I can do something different here but hopefully it'll come across OK.
And, now that we have told Splunk what field to use as _time, things like timechart will work.
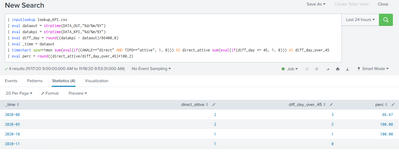
And in timechart, you can actually do some pretty complex conditional expressions if you want.
Much of this can also be done by replacing the `timechart span=1mon` command with the pair of commands `bin span=1mon _time` and a big stats like the timechart, split by _time.
Stats is more versatile, but I think either works fine in this case. Stats may also be *slightly* better performing if you are in a large Splunk distributed system, but I doubt the difference is large.
And as mentioned, if you want to move that complexity out of the timechart/stats command and into its own eval, it would look like this:
You can do a similar thing with the timechart one too.
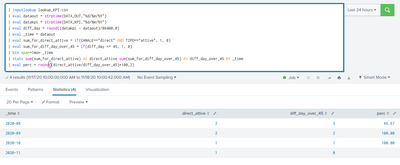
As promised, the actual code, stats one with separate evals first because that's what's on my screen right now and I'm lazy. KEEP IN MIND that you'll have to swap out my `| inputlookup lookup_KPI.csv` command for your own search, and fix up those dates again back to the right way. Also change field names in the "AS blah" sections.
| inputlookup lookup_KPI.csv
| eval dataout = strptime(DATA_OUT,"%d/%m/%Y")
| eval datakpi = strptime(DATA_KPI,"%d/%m/%Y")
| eval diff_day = round((datakpi - dataout)/86400,0)
| eval _time = dataout
| eval sum_for_direct_attive = if(CANALE=="direct" AND TIPO=="attive", 1, 0)
| eval sum_for_diff_day_over_45 = if(diff_day <= 45, 1, 0)
| bin span=1mon _time
| stats sum(sum_for_direct_attive) AS direct_attive sum(sum_for_diff_day_over_45) AS diff_day_over_45 BY _time
| eval perc = round((direct_attive/diff_day_over_45)*100,2)
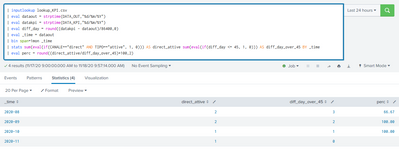
Stats one with sum(eval...) syntax:
| inputlookup lookup_KPI.csv
| eval dataout = strptime(DATA_OUT,"%d/%m/%Y")
| eval datakpi = strptime(DATA_KPI,"%d/%m/%Y")
| eval diff_day = round((datakpi - dataout)/86400,0)
| eval _time = dataout
| bin span=1mon _time
| stats sum(eval(if(CANALE=="direct" AND TIPO=="attive", 1, 0))) AS direct_attive sum(eval(if(diff_day <= 45, 1, 0))) AS diff_day_over_45 BY _time
| eval perc = round((direct_attive/diff_day_over_45)*100,2)
And the timechart one, just for good measure.
| inputlookup lookup_KPI.csv
| eval dataout = strptime(DATA_OUT,"%d/%m/%Y")
| eval datakpi = strptime(DATA_KPI,"%d/%m/%Y")
| eval diff_day = round((datakpi - dataout)/86400,0)
| eval _time = dataout
| timechart span=1mon sum(eval(if(CANALE=="direct" AND TIPO=="attive", 1, 0))) AS direct_attive sum(eval(if(diff_day <= 45, 1, 0))) AS diff_day_over_45
| eval perc = round((direct_attive/diff_day_over_45)*100,2)
I hope this gets you the answers you need!
Happy Splunking,
Rich
- Mark as New
- Bookmark Message
- Subscribe to Message
- Mute Message
- Subscribe to RSS Feed
- Permalink
- Report Inappropriate Content
Hi Rich,
you don't know how grateful I am, not so much for the code,, which works great, but above all because you explained to me many things that were not clear to me.
Were you able to make me understand how to set up a search in splunk and understand how to use commands and functions together.
I answer your words, let's start with ... luckily I'm not color blind 🙂 so I understand all your steps well.
I have fixed some things in the code that I may not have explained well; the condition <= 45 must be applied only to those events that satisfy the first condition, i.e. I have to count:
1) how many are sum_for_direct_active (and here and OK)
2) of these sum_for_direct_active, how many are <= 45 ??
then your line:
| eval sum_for_diff_day_over_45 = if (diff_day <= 45, 1, 0)
I replaced it with:
| eval sum_for_diff_day_over_45 = if (CHANNEL == "direct" AND TYPE == "active" AND diff_day <= 45, 1, 0)
and I got the correct value.
Also I changed:
| eval perc = round ((direct_active / diff_day_over_45) * 100,2)
with
| eval perc = round ((diff_day_over_45 / direct_attive) * 100,2)
for which
| eval _time = dataout IS GREAT !! 😃
I took the stats instead of the timechart as a suggestion and also used
eval sum_for_diff_day_over_45 = if (CHANNEL == "direct" AND TYPE == "active" AND diff_day <= 45, 1, 0)
which seems to me a cleaner style instead of
| stats sum (eval (if (CHANNEL == "direct" AND TYPE == "active", 1, 0))) AS direct_attive sum (eval (if (diff_day <= 45, 1, 0))) AS diff_day_over_45 BY _time
I see it more complicated to read and understand.
YOUR SUGGESTION WAS GREAT !!😃
Thank you so much you made me understand a lot.😊
There are 2 things I want to ask you:
1) Why did you put the sum after the stats?
| stats sum (sum_for_direct_attive) AS direct_attive sum (sum_for_diff_day_over_45) AS diff_day_over_45 BY _time
it would never have occurred to me to put it on;
I haven't tried without, tomorrow I'll try,
but I don't know why.
2) I realized that in my splunk despite having set 3 months to Latest, there are, in the DATA_OUT field, dates that refer to 2018, so events from the months of 2018 return to me.
I would only like the last 3 months back, so from August.
I also inserted in the first condition> = 2020-08- * but I don't like it very much.
| eval sum_for_direct_attive = if (CHANNEL == "direct" AND TYPE == "active" AND DATA_OUT> = "2020-08- *", 1, 0)
Is there a better way to drop the months back and only take the last 3?
You have really given me an edge in understanding SPlunk and I will be truly grateful to you.
Thank you so much😊😊
You are a great Rich !!! 💪👍🔝🔝🔝🔝
See you soon
Bye
Antonio
- Mark as New
- Bookmark Message
- Subscribe to Message
- Mute Message
- Subscribe to RSS Feed
- Permalink
- Report Inappropriate Content
Aww, thank you. I'm glad you found it useful.
Your changes look perfect to me - and I had to laugh, I usually write when I do division to come up with percentages that I *always* do the math backwards and that you'll probably have to fix it. Glad you noticed without me telling you to.
For the sum in the stats - Well, the calculations were going to be harder to do an actual count, or maybe not harder, but would look less clear? Counting things is really just summing up "1" each time you count an item, right? So I've gotten used to, whenever I'm dealing with a *conditional* count to use the sum of 1 when it matches, 0 when it doesn't. It just seems easier to understand.
(And obviously, for simple cases where you just want a count, you just `stats count by _time` or whatever, plain old "count" works fantastically well in that case.)
Excellent work on fixing me having forgotten your 45 day limit. That's probably why my numbers didn't match yours. 🙂
For your last question on dates and old data, I guess the question here really is, how is this data being ingested? In my mind, the rightest answer to this problem is to re-ingest the data (I assume it's not huge and it's in a text file somewhere?) and when you set up that input make sure it is reading the dates correctly, and using the right date field as the date to use for _time.
You can see I hacked in a way to make it work, assigning _time to one of the interpreted date fields using eval, but it would be better to just have that step done on the input itself.
(https://docs.splunk.com/Documentation/Splunk/8.1.0/Data/Configuretimestamprecognition)
If you did that, then your time picker would work. You could just pick "last 3 months" from the time picker in the upper right, and it'd filter everything correctly.
But, since we don't have that set up yet, I did a thing:
| eval _time = dataout
| eval oldest = relative_time(now(), "-3mon@mon"), newest = relative_time(now(), "@mon")
| where _time > oldest AND _time < newest
| bin span=1mon _time
I didn't include the whole mess, just included the two lines you can add (and a line before and after it so you can see where it fits - after we eval a _time, and before we do the bin on _time.).
What I do there is create two fields using a function in splunk called "relative_time". Here's how relative time works and in there is other links to various other things that may help understanding it.
https://docs.splunk.com/Documentation/SCS/current/Search/Specifyrelativetime
The first field is the oldest records we want to keep, so I set it to "-3 months ago (e.g. "before now()"), snapped to the beginning of that month" with the setting "-3mon@mon". So run here in the middle of November 18th, it'll go back three months to August 18th then back to the beginning of that month, August 1.
I also snapped the newest records we want to the beginning of this month, Nov 1.
You actually probably don't want any snapping, now that I've said all that. I think you probably want those to read "-3mon" and not even create the newest value at all. Then obviously if that's the case your where gets simpler.
So if you don't want the snapping, try:
| eval _time = dataout
| eval oldest = relative_time(now(), "-3mon")
| where _time > oldest
| bin span=1mon _time
In any case, I think you know where you'll have to look (the input and whatnot) for fixing this "generically" so the time picker works, and that even without this, you should have you a reasonable workaround.
Let me know if that all works!
- Mark as New
- Bookmark Message
- Subscribe to Message
- Mute Message
- Subscribe to RSS Feed
- Permalink
- Report Inappropriate Content
But why do you calculate the percentage in reverse? 😃😃😃
I laughed too on this occasion 😉
Thanks for the explanations, always very useful for beginners.
the "sum" I meant is this:
| stats SUM (sum_for_direct_attive) AS direct_attive SUM (sum_for_diff_day_over_45) AS diff_day_over_45 BY _time
In this context, I don't understand what adds up
while adding 1 if the condition is satisfied and zero when it is not, it seems to me an excellent solution to be sure of having the correct sum.
After I answered you last night, I was on my way to bed and something similar to the one you suggested for the past 3 months occurred to me.
Use relative_time (now (), "-3mon @ mon") or latest to go back 3 months.
The data on splunk is millions, I can't import again, mainly because I don't have admin privileges, I'm just a simple "Power" 😄
They are imported correctly, the DATA_OUT field has a date that refers to an action performed on that date and remains so until an action is performed again (date when the status changed).
For this reason, also on November 18th in this field I can find the date of February 8th 2018.
However, this value does not interest me as it is too far back in time.
Now I just have to figure out if relative_time (now (), "-3mon @ mon") takes me to August 1st or August 19th (if I run the command today).
Anyway, I don't think it's a big deal to fix this.
Thanks again for your precious explanations, it is a pleasure to talk to you, I hope there is still an opportunity to do so.👍
See you soon
Bye
Antonio
- Mark as New
- Bookmark Message
- Subscribe to Message
- Mute Message
- Subscribe to RSS Feed
- Permalink
- Report Inappropriate Content
Ah, those sums.
I'm not quite sure if you then answered your own question?
In any case, leave off the `| stats ... ` and everything after it, and you'll see that the field 'sum_for_direct_attive` and that other field are both either 0 or 1 depending on the eval we did earlier. Which that eval is really just a replacement for the previous examples inline evals in the stats command itself.
So, since we've created those fields before the stats command, we can just sum up the 1's and 0's of those events appropriately.
inline evals in stats can be great, but sometimes they just make the stats command really complex looking, so sometimes it's better to just split those out into their own little bits of logic so they're easier to understand and work on.
And in case you didn't figure it out, "-3mon@mon" would go back to August 1st.
You can mix and match those too. "-90d" goes back 90 days from this time right now, but "-90d@d" goes back to the midnight that happened just before day 90 ago.
"-3mon@d" goes back three months, then backs up until midnight of that day to include the entire day from 3 months ago, instead of only the partial day.
- Mark as New
- Bookmark Message
- Subscribe to Message
- Mute Message
- Subscribe to RSS Feed
- Permalink
- Report Inappropriate Content
Hi Rich,
now it's clear !!!
Eval generates a new field with the elements 0 and 1 depending on the true or false condition.
The SUM after, sums all the elements of the created field.
I had confused "sum" in the variable name,
The -3mon @ mon in my query took dates from 2020-08-18, for this I had to add:
| eval threemonthsago = strftime (relative_time (oldest, "@mon"), "% Y-% m-% d")
But now a strange thing happens to me (surely I'm wrong :))
if I put -9mon @ mon it takes into account the dates of February (ok, correct) but it goes until August and not until November as I expected.
IMPORTANT: at the top right I chose "latest 3 months.
If instead I write -3mon @ mon always with latest 3 months, it returns me from August to November
Why??
Does the latest 3 m3si have anything to do with it?
This behavior is not clear to me.
Anyway, I don't want to address all my doubts in this post, otherwise I will have to pay you for the lessons you are providing 🙂
I like to understand why things, but I certainly don't want to take advantage of your kindness and patience.
I still have to study a lot .......
You have already helped me a lot in understanding and making my query work.
I thank you for this
See you soon
Antonio
- Mark as New
- Bookmark Message
- Subscribe to Message
- Mute Message
- Subscribe to RSS Feed
- Permalink
- Report Inappropriate Content
UPDATE:
I inserted these 2 lines at the top after the index:
| eval oldest = relative_time (now (), "-3mon")
| eval threemonthsago= strftime (relative_time (oldest, "@mon"), "% Y-% m-% d")
| where DATA_OUT> = threemonthsago
in this way I always take the previous 3 months starting from the first of each month.
If you want I can change the search to 4,5,6 .... months back by changing only the -3mon 🙂
very good solution !!!
Thanks to your suggestions
- Mark as New
- Bookmark Message
- Subscribe to Message
- Mute Message
- Subscribe to RSS Feed
- Permalink
- Report Inappropriate Content
Do you have a few lines worth of the original data you can provide? I'm having a hard time envisioning what it is we're doing.
It might also help if you could rephrase what it is you want. You've told us in the beginning how it is you expect to calculate what it is, but not ... not what it actually is. Is it calculating the percentage of KPIs "complete" within 45 days of first being noted?
Lastly, just on a whim, I notice you created a field called `Month` but then didn't use it to split your timechart by. I don't think this will help you, but try changing your last line to
| timechart count(DATA_OUT) BY MonthYou probably already tried that one, and it'll be similar to the thing you already have written. But I figured, it is worth a shot just in case it's that tiny change makes it all better for you!
Anyway, sample data please?
Thanks and happy Splunking,
Rich
- Mark as New
- Bookmark Message
- Subscribe to Message
- Mute Message
- Subscribe to RSS Feed
- Permalink
- Report Inappropriate Content
Hi Rich,
Thanks for the reply.
You're right, I asked the question but I didn't say what I expect.
I have already tried to use: | timechart count (DATA_OUT) BY Month but the result is always the same it calculates the count divided by month but only of the events returned at the end of the query.
Here are the data:
file _raw:
ID LINK CANALE TIPO DATA_OUT DATA_KPI …………… 1cond 2cond
——————-----------------————————————————————————
1 123 direct attive 10/08/2020 21/09/2020 …………. (YES) (YES)
2 100 indirect passive 15/08/2020 24/08/2020 …………… (NO) (YES)
3 213 direct attive 11/08/2020 11/09/2020 …………. (YES) (YES)
4 333 compete natural 25/09/2020 06/11/2020 …………… (NO) (NO)
5 150 external verify 01/10/2020 24/10/2020 …………… (NO) (YES)
6 223 direct attive 07/09/2020 09/10/2020 …………. (YES) (YES)
7 224 direct attive 13/10/2020 30/11/2020 …………. (YES) (NO)
8 122 indirect passive 15/08/2020 24/10/2020 …………… (NO) (NO)
9 216 direct attive 01/09/2020 18/11/2020 …………. (YES) (NO)
10 217 direct attive 01/11/2020 null …………. (YES) (NO)
if the first condition is satisfied, total_count increase
if the first and second conditions are satisfied, count_event increment
RESULT 1cond: | where CANALE="DIRECT" AND TIPO="ATTIVE" total_count by month
Aug 2 (ID: 1,3)
Sep 2 (ID: 6,9)
Oct 1 (ID: 7 )
Nov 1 (ID: 10 )
Now I check how many of all these have a difference of 45 days between DATA_KPI and DATA_OUT:
I want the result to be:
RESULT 2cond: | where diff_day <= 45 count_event by month
Aug 2 (ID: 1,3)
Sep 1 (ID: 6)
Oct 0
Nov 0
Now the percentage for each of them (consider that the values are not that low)
My final table count by month: perc=round((count_event/total_count)*100,2)
Mount total_count count_event percent
————————————————————————
Aug 2 2 100%
Sep 2 1 50%
Oct 1 0 0%
Nov 1 0 0%
so it sure is clearer 🙂
Then I think in the end it is not difficult to add all the total_count and the count_even to also have a general count.
Thanks again
Bye
Antonio
