Join the Conversation
- Find Answers
- :
- Using Splunk
- :
- Splunk Search
- :
- Re: Merge Powershell errors outputs from Universal...
- Subscribe to RSS Feed
- Mark Topic as New
- Mark Topic as Read
- Float this Topic for Current User
- Bookmark Topic
- Subscribe to Topic
- Mute Topic
- Printer Friendly Page
- Mark as New
- Bookmark Message
- Subscribe to Message
- Mute Message
- Subscribe to RSS Feed
- Permalink
- Report Inappropriate Content
Hello all,
We receive the "splunkd.log" from every Universal Forwarder into our "_internal" index. There are some events with log_level=ERROR that I need to analize, some of them are related to PowerShell script execution errors.
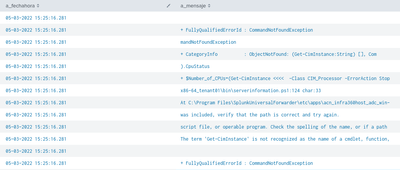
The issue with this events is that the script outputs the error in several lines and the event is splitted in multiple events, all of them with the same "_time" (in the image below, the field "a_fechahora" is = _time)
I was able to merge the "a_mensaje" rows by "_time", but there are some issue with the order of the rows:
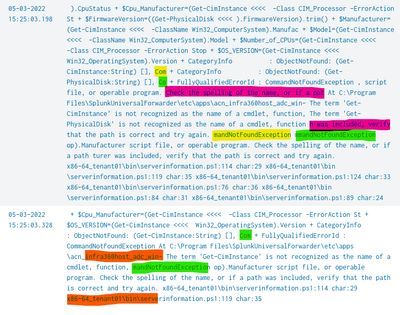
E.g.
As you can see in green, the "Co" statement is incomplete, and it continues some lines below with the "mmandNotFoundException". Same happens with "or if a pat" (...) "h was included"
Is this a common / known issue? Is there any way to prevent this messed lines in powershell outputs?
Regards,
- Mark as New
- Bookmark Message
- Subscribe to Message
- Mute Message
- Subscribe to RSS Feed
- Permalink
- Report Inappropriate Content
The solution for this is to use streamstats/sort
The events will arrive in Splunk with the same time, but will come out of Splunk in the search in the reverse order of ingest sequence. You can see that behaviour in your original example.
So, to handle that situation, you should use "streamstats c" (same as streamstats count)
In this way, the events will be assigned a number with 1 being the latest message sequence. You can then sort by - c and reverse the sequence and then use stats list (don't use values, as that removes duplicates and will sort the values).
Here's your example
| makeresults | eval _time=now(), broken_message="order, in only one event."
| append
    [ | makeresults |  eval _time=now(), broken_message="ge it in the correct " ]
| append
    [ | makeresults |  eval _time=now(), broken_message="events, and I need to mer" ]
| append
    [ | makeresults | eval _time=now(),  broken_message="in multiple " ]
| append
    [ | makeresults | eval _time=now(), broken_message="is broken " ]
| append
    [ | makeresults | eval _time=now(), broken_message="This message" ]
| streamstats c
| sort - c
| stats list(broken_message) as message by _time
| eval message=mvjoin(message, "")
- Mark as New
- Bookmark Message
- Subscribe to Message
- Mute Message
- Subscribe to RSS Feed
- Permalink
- Report Inappropriate Content
There is probably a way to fix the original issue, but as far as merging your data correctly, how are you doing it?
The rows in your initial table appear to be in the correct reverse order, so it should be possible to order them correctly with
| sort _time
| stats list(_raw) as _raw by _time
| eval _raw=mvjoin(_raw, "")
- Mark as New
- Bookmark Message
- Subscribe to Message
- Mute Message
- Subscribe to RSS Feed
- Permalink
- Report Inappropriate Content
The problem is that the _time field is exactly the same between events, and there is no way to "sort" it in a logical way. I've created this search as an example:
| makeresults | eval _time=now(), broken_message="order, in only one event."
| append
    [ | makeresults |  eval _time=now(), broken_message="ge it in the correct" ]
| append
    [ | makeresults |  eval _time=now(), broken_message="events, and I need to mer" ]
| append
    [ | makeresults | eval _time=now(),  broken_message="in multiple" ]
| append
    [ | makeresults | eval _time=now(), broken_message="is broken" ]
| append
    [ | makeresults | eval _time=now(), broken_message="This message" ]
This is the output:
| _time | broken_message |
| 2022-05-06 12:06:04 | order, in only one event. |
| 2022-05-06 12:06:04 | ge it in the correct |
| 2022-05-06 12:06:04 | events, and I need to mer |
| 2022-05-06 12:06:04 | in multiple |
| 2022-05-06 12:06:04 | is broken |
| 2022-05-06 12:06:04 | This message |
The way I find to merge the message is this:
| eventstats values(broken_message) as message by _time
| mvcombine delim="" message
| table message
And this is the result with the wrong order:
| message |
| This message events, and I need to mer ge it in the correct in multiple is broken order, in only one event. |
The output of your suggested method is not exactly the same, but it is also disordered:
| sort _time
| eventstats list(broken_message) as message by _time
| mvcombine delim="" message
| table message
Note that I needed to add "mvcombine" in order to merge the "list" output in a single line. And here is the output:
| message |
| order, in only one event. ge it in the correct events, and I need to mer in multiple is broken This message |
So, there is no logical way to sort it in the correct way. That's why my first question was related to the powershell ERROR output in _internal index. I suppose the same happens in every Splunk instance, is not an isolated error. So, Is this a know issue? and if so, is there a workaround for this?
- Mark as New
- Bookmark Message
- Subscribe to Message
- Mute Message
- Subscribe to RSS Feed
- Permalink
- Report Inappropriate Content
The solution for this is to use streamstats/sort
The events will arrive in Splunk with the same time, but will come out of Splunk in the search in the reverse order of ingest sequence. You can see that behaviour in your original example.
So, to handle that situation, you should use "streamstats c" (same as streamstats count)
In this way, the events will be assigned a number with 1 being the latest message sequence. You can then sort by - c and reverse the sequence and then use stats list (don't use values, as that removes duplicates and will sort the values).
Here's your example
| makeresults | eval _time=now(), broken_message="order, in only one event."
| append
    [ | makeresults |  eval _time=now(), broken_message="ge it in the correct " ]
| append
    [ | makeresults |  eval _time=now(), broken_message="events, and I need to mer" ]
| append
    [ | makeresults | eval _time=now(),  broken_message="in multiple " ]
| append
    [ | makeresults | eval _time=now(), broken_message="is broken " ]
| append
    [ | makeresults | eval _time=now(), broken_message="This message" ]
| streamstats c
| sort - c
| stats list(broken_message) as message by _time
| eval message=mvjoin(message, "")
- Mark as New
- Bookmark Message
- Subscribe to Message
- Mute Message
- Subscribe to RSS Feed
- Permalink
- Report Inappropriate Content
This is exactly what I needed. Now the output is in the correct order. Thanks!!


