Are you a member of the Splunk Community?
- Find Answers
- :
- Using Splunk
- :
- Splunk Search
- :
- Re: timechart
- Subscribe to RSS Feed
- Mark Topic as New
- Mark Topic as Read
- Float this Topic for Current User
- Bookmark Topic
- Subscribe to Topic
- Mute Topic
- Printer Friendly Page
- Mark as New
- Bookmark Message
- Subscribe to Message
- Mute Message
- Subscribe to RSS Feed
- Permalink
- Report Inappropriate Content
How to use timechart to display failed user login info, sorted by time/date of each login attempt?
I'm trying to display failed user login information by using a timechart but I'm not sure how to show the time and date of the logins for each of the user
This is my code :
source="General-linux-sql.log" AND sourcetype="Linux" AND "Failure Audit" AND "Logon "
| rex "User Name\: (?<User_Name>[^\s]+)"
| timechart count by User_Name
This is the output that I get. Also, how do I change it so that all the users are separated?
- Mark as New
- Bookmark Message
- Subscribe to Message
- Mute Message
- Subscribe to RSS Feed
- Permalink
- Report Inappropriate Content
How do I display the time for each of the logins as well?
- Mark as New
- Bookmark Message
- Subscribe to Message
- Mute Message
- Subscribe to RSS Feed
- Permalink
- Report Inappropriate Content
you can do the following to see users
- change area chart to line chart (OR) column chart
- If you choose line chart, Format -> General -> Multi series mode -> yes
you can play with both chart type & format options to improve look and feel.
Hope this helps
- Mark as New
- Bookmark Message
- Subscribe to Message
- Mute Message
- Subscribe to RSS Feed
- Permalink
- Report Inappropriate Content
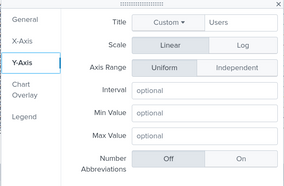
Thanks for the solution! However, now I have another problem with the Y-axis title. The title is now unreadable even though I changed it. Do you have any fix for this?
- Mark as New
- Bookmark Message
- Subscribe to Message
- Mute Message
- Subscribe to RSS Feed
- Permalink
- Report Inappropriate Content
Have you tried trellis as visualization? It should work if you have less than 20 user and if more then you must divide those to group of 20.
r. Ismo
- Mark as New
- Bookmark Message
- Subscribe to Message
- Mute Message
- Subscribe to RSS Feed
- Permalink
- Report Inappropriate Content


