
Turn on suggestions
Auto-suggest helps you quickly narrow down your search results by suggesting possible matches as you type.
Splunk Search
×
Join the Conversation
Without signing in, you're just watching from the sidelines. Sign in or Register to connect, share, and be part of the Splunk Community.
- Find Answers
- :
- Using Splunk
- :
- Splunk Search
- :
- Re: How to split multivalue fields after lookup?
Options
- Subscribe to RSS Feed
- Mark Topic as New
- Mark Topic as Read
- Float this Topic for Current User
- Bookmark Topic
- Subscribe to Topic
- Mute Topic
- Printer Friendly Page
- Mark as New
- Bookmark Message
- Subscribe to Message
- Mute Message
- Subscribe to RSS Feed
- Permalink
- Report Inappropriate Content

skiourus
New Member
11-02-2017
08:22 AM
Hello after a search like this:
index=myindex|lookup mycsv.csv host_ip
I have the following output:
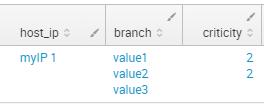
I would like to make it looks like this
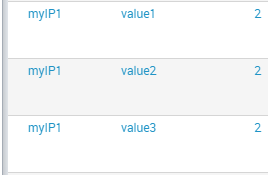
assuming that the criticity is unique per host_ip regardless the number of time it appears.
Any help is welcome thanks.


1 Solution
- Mark as New
- Bookmark Message
- Subscribe to Message
- Mute Message
- Subscribe to RSS Feed
- Permalink
- Report Inappropriate Content

kamlesh_vaghela

SplunkTrust
11-02-2017
10:26 AM
Hi
Can you please try below search??
YOUR_SEARCH
| eval tempField=mvzip(mvzip(host_ip,branch),criticity)
| stats count by _time, tempField
| eval host_ip=mvindex(split(tempField,","),0),
    branch=mvindex(split(tempField,","),1),
    criticity=mvindex(split(tempField,","),2)
Thanks
- Mark as New
- Bookmark Message
- Subscribe to Message
- Mute Message
- Subscribe to RSS Feed
- Permalink
- Report Inappropriate Content
skiourus
New Member
11-08-2017
07:28 AM
Thank you all for your solutions.
I finally solved it by this command
index=myindex
| lookup mycsv.csv host_ip
| stats count by host_ip,branch,criticity
| fields -count
it is time consuming but it does the job!
- Mark as New
- Bookmark Message
- Subscribe to Message
- Mute Message
- Subscribe to RSS Feed
- Permalink
- Report Inappropriate Content

somesoni2
Revered Legend
11-02-2017
11:25 AM
Try this
index=myindex|lookup mycsv.csv host_ip
| mvexpand branch | eval criticity=mvdedup(criticity)
- Mark as New
- Bookmark Message
- Subscribe to Message
- Mute Message
- Subscribe to RSS Feed
- Permalink
- Report Inappropriate Content
kamlesh_vaghela
SplunkTrust
11-02-2017
10:26 AM
Hi
Can you please try below search??
YOUR_SEARCH
| eval tempField=mvzip(mvzip(host_ip,branch),criticity)
| stats count by _time, tempField
| eval host_ip=mvindex(split(tempField,","),0),
    branch=mvindex(split(tempField,","),1),
    criticity=mvindex(split(tempField,","),2)
Thanks
- Mark as New
- Bookmark Message
- Subscribe to Message
- Mute Message
- Subscribe to RSS Feed
- Permalink
- Report Inappropriate Content
elliotproebstel
Champion
11-02-2017
09:58 AM
I think mvexpand should do what you need. Here's some documentation on it:
http://docs.splunk.com/Documentation/SplunkCloud/6.6.3/SearchReference/Mvexpand
Try adding this to the end of your query:
| mvexpand branch

Got questions? Get answers!
Join the Splunk Community Slack to learn, troubleshoot, and make connections with fellow Splunk practitioners in real time!
Meet up IRL or virtually!
Join Splunk User Groups to connect and learn in-person by region or remotely by topic or industry.
Get Updates on the Splunk Community!
Make Your Machine Data AI-Ready in Splunk
Every team is getting ready for AI agents.
Thursday, November 12, 2026 | 11AM PST / 2PM EST
...
Splunk Asynchronous Forwarding Explained
Splunk asynchronous forwarding is often misunderstood as simply setting autoLBVolume. That is not quite right. ...
How to Monitor AI Agents with Splunk Agent Observability
Let’s say I’m running a travel planning AI app in production. A user asks for three concise hotel options in ...
