Join the Conversation
- Find Answers
- :
- Using Splunk
- :
- Splunk Search
- :
- Re: How to normalize event counts of disparate dat...
- Subscribe to RSS Feed
- Mark Topic as New
- Mark Topic as Read
- Float this Topic for Current User
- Bookmark Topic
- Subscribe to Topic
- Mute Topic
- Printer Friendly Page
- Mark as New
- Bookmark Message
- Subscribe to Message
- Mute Message
- Subscribe to RSS Feed
- Permalink
- Report Inappropriate Content
This is a follow up question to a previously answered question I asked on timechart counts (here).
Now that I've got the count fixed with a bin and dedup, I'm trying to figure out how to co-mingle data sources of varying polling intervals. How would I go about merging disparate data sources with separate extracts that have different polling intervals?
For example, when comparing a 10 minute poll interval extract with a 5 minute, I get gaps in the longer interval source (because of the bin); here's a sample query, and screenshot of the timechart:
.. sourcetype=server:sessions OR sourcetype=switch:sessions | bin _time span=5m | dedup UserName, _time | timechart count(serverfield) as ActiveServer, count(switchfield) as ActiveSwitch
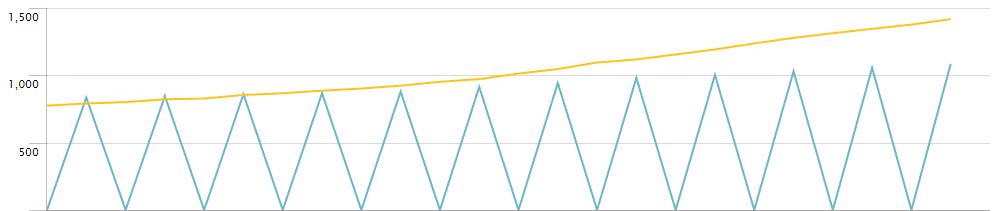
How would I normalize the 10 minute extract next to the 5 minute in the same timechart? Is there some way to fill in the gaps for the extract that runs less frequently?
- Mark as New
- Bookmark Message
- Subscribe to Message
- Mute Message
- Subscribe to RSS Feed
- Permalink
- Report Inappropriate Content
What if you added in a span for the timechart itself? You would need to calculate the "5-minute counts" first, though
.. sourcetype=server:sessions OR sourcetype=switch:sessions
| bin _time span=5m | dedup UserName, _time
| stats count(serverfield) as ActiveServer count(switchfield) as ActiveSwitch by _time
| timechart span=10m avg(ActiveServer) as ActiveServer, sum(ActiveSwitch) as ActiveSwitch
For the field that has multiple observations per 10-minute time period, take the average. For the field that has only 1 observation, take the sum.
- Mark as New
- Bookmark Message
- Subscribe to Message
- Mute Message
- Subscribe to RSS Feed
- Permalink
- Report Inappropriate Content
Thank you very much, this method did the trick!!
Data Management Digest – December 2025
Index This | What is broken 80% of the time by February?
Unlock Faster Time-to-Value on Edge and Ingest Processor with New SPL2 Pipeline ...
