Join the Conversation
- Find Answers
- :
- Using Splunk
- :
- Splunk Search
- :
- How to normalize event counts of disparate data ex...
- Subscribe to RSS Feed
- Mark Topic as New
- Mark Topic as Read
- Float this Topic for Current User
- Bookmark Topic
- Subscribe to Topic
- Mute Topic
- Printer Friendly Page
- Mark as New
- Bookmark Message
- Subscribe to Message
- Mute Message
- Subscribe to RSS Feed
- Permalink
- Report Inappropriate Content
This is a follow up question to a previously answered question I asked on timechart counts (here).
Now that I've got the count fixed with a bin and dedup, I'm trying to figure out how to co-mingle data sources of varying polling intervals. How would I go about merging disparate data sources with separate extracts that have different polling intervals?
For example, when comparing a 10 minute poll interval extract with a 5 minute, I get gaps in the longer interval source (because of the bin); here's a sample query, and screenshot of the timechart:
.. sourcetype=server:sessions OR sourcetype=switch:sessions | bin _time span=5m | dedup UserName, _time | timechart count(serverfield) as ActiveServer, count(switchfield) as ActiveSwitch
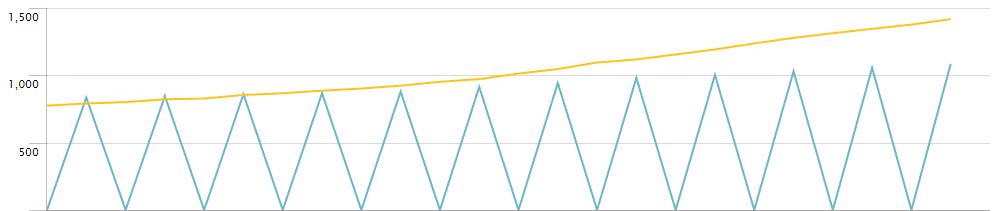
How would I normalize the 10 minute extract next to the 5 minute in the same timechart? Is there some way to fill in the gaps for the extract that runs less frequently?
- Mark as New
- Bookmark Message
- Subscribe to Message
- Mute Message
- Subscribe to RSS Feed
- Permalink
- Report Inappropriate Content
What if you added in a span for the timechart itself? You would need to calculate the "5-minute counts" first, though
.. sourcetype=server:sessions OR sourcetype=switch:sessions
| bin _time span=5m | dedup UserName, _time
| stats count(serverfield) as ActiveServer count(switchfield) as ActiveSwitch by _time
| timechart span=10m avg(ActiveServer) as ActiveServer, sum(ActiveSwitch) as ActiveSwitch
For the field that has multiple observations per 10-minute time period, take the average. For the field that has only 1 observation, take the sum.
- Mark as New
- Bookmark Message
- Subscribe to Message
- Mute Message
- Subscribe to RSS Feed
- Permalink
- Report Inappropriate Content
Thank you very much, this method did the trick!!
Enter the Agentic Era with Splunk AI Assistant for SPL 1.4
Stronger Security with Federated Search for S3, GCP SQL & Australian Threat ...
Accelerating Observability as Code with the Splunk AI Assistant
