
Turn on suggestions
Auto-suggest helps you quickly narrow down your search results by suggesting possible matches as you type.
Splunk Search
×
Join the Conversation
Without signing in, you're just watching from the sidelines. Sign in or Register to connect, share, and be part of the Splunk Community.
- Find Answers
- :
- Using Splunk
- :
- Splunk Search
- :
- How to get fields into a bar chart?
Options
- Subscribe to RSS Feed
- Mark Topic as New
- Mark Topic as Read
- Float this Topic for Current User
- Bookmark Topic
- Subscribe to Topic
- Mute Topic
- Printer Friendly Page
- Mark as New
- Bookmark Message
- Subscribe to Message
- Mute Message
- Subscribe to RSS Feed
- Permalink
- Report Inappropriate Content
How to get fields into a bar chart?

nkavouris
Path Finder
12-15-2023
07:47 AM
I have a search as follows:
index=*|
search sourcetype=*|
spath logs{} output=logs|
spath serial_number output=serial_number|
spath result output=result|
table serial_number result|
```stats dc(serial_number) as throughput|```
stats
count(eval(if(result="Fail",1,null()))) as failures
count(eval(if(result="Pass",1,null()))) as passes
|
This returns a table shown in the capture with failures=215 and passes=350
how can i get these results as two sperate bars in one bar chart? basically want to show the pass/fail rate
sample of the JSON data i am working with:
{"serial_number": "30913JC0024EW1482300425", "type": "Test", "result": "Pass", "logs": [
{"test_name": "UGC Connect", "result": "Pass"}, {"test_name": "Disable UGC USB Comm Watchdog", "result": "Pass"},
{"test_name": "Hardware Rev", "result": "Pass", "received": "4"}, {"test_name": "Firmware Rev", "result": "Pass", "received": "1.8.3.99", "expected": "1.8.3.99"},
{"test_name": "Set Serial Number", "result": "Pass", "received": "1 A S \n", "expected": "1 A S"},
{"test_name": "Verify serial number", "result": "Pass", "received": "JC0024EW1482300425", "expected": "JC0024EW1482300425", "reason": "Truncated full serial number: 30913JC0024EW1482300425 to JC0024EW1482300425"},
{"test_name": "Thermocouple", "pt1_ugc": "24969.0", "pt1": "25000", "pt2_ugc": "19954.333333333332", "pt2": "20000", "pt3_ugc": "14993.666666666666", "pt3": "15000", "result": "Pass", "tolerance": "1000 deci-mV"},
{"test_name": "Cold Junction", "result": "Pass", "ugc_cj": "278", "user_temp": "270", "tolerance": "+ or - 5 C"},
{"test_name": "Glow Plug Open and Short", "result": "Pass", "received": "GP Open, Short, and Load verified OK.", "expected": "GP Open, Short, and Load verified OK."},
{"test_name": "Glow Plug Power On", "result": "Pass", "received": "User validated Glow Plug Power"},
{"test_name": "Glow Plug Measure", "pt1_ugc": "848", "pt1": "2070", "pt1_tolerance": "2070", "pt2_ugc": "5201", "pt2": "5450", "pt2_tolerance": "2800", "result": "Pass"},
{"test_name": "Motor Soft Start", "result": "Pass", "received": "Motor Soft Start verified", "expected": "Motor Soft Start verified by operator"},
{"test_name": "Motor", "R_rpm_ugc": 1525.0, "R_rpm": 1475, "R_v_ugc": 160.0, "R_v": 155, "R_rpm_t": 150, "R_v_t": 160, "R_name": "AUGER 320 R", "F_rpm_ugc": 1533.3333333333333, "F_rpm": 1475, "F_v_ugc": 164.0, "F_v": 182, "F_rpm_t": 150, "F_v_t": 160, "F_name": "AUGER 320 F", "result": "Pass"},
{"test_name": "Fan", "ugc_rpm": 2436.0, "rpm": 2130, "rpm_t": 400, "ugc_v": 653.3333333333334, "v": 630, "v_t": 160, "result": "Pass"},
{"test_name": "RS 485", "result": "Pass", "received": "All devices detected", "expected": "Devices detected: ['P']"},
{"test_name": "Close UGC Port", "result": "Pass"},
{"test_name": "DFU Test", "result": "Pass", "received": "Found DFU device"},
{"test_name": "Power Cycle", "result": "Pass", "received": "User confirmed power cycle"},
{"test_name": "UGC Connect", "result": "Pass"},
{"test_name": "Close UGC Port", "result": "Pass"},
{"test_name": "USB Power", "result": "Pass", "received": "USB Power manually verified"}]}
- Mark as New
- Bookmark Message
- Subscribe to Message
- Mute Message
- Subscribe to RSS Feed
- Permalink
- Report Inappropriate Content

dtburrows3
Builder
12-15-2023
09:18 AM
Adding a by-field of "serial_number" in you final stats will display you chart like this.
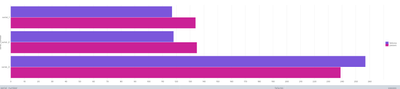
Similarly, instead of the stats you could do a
    | chart
        count as count
            over serial_number
            by result
and this should give you results ver similar.
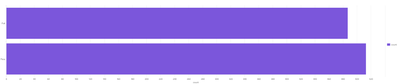
For an overall Pass/Fail visual across all serial number you can do a stats like this
    | stats
        count as count
            by result
and the resulting chart shows something like this
- Mark as New
- Bookmark Message
- Subscribe to Message
- Mute Message
- Subscribe to RSS Feed
- Permalink
- Report Inappropriate Content

ITWhisperer

SplunkTrust
12-15-2023
09:10 AM
| eval test="Test"
| table test passes failures

Got questions? Get answers!
Join the Splunk Community Slack to learn, troubleshoot, and make connections with fellow Splunk practitioners in real time!
Meet up IRL or virtually!
Join Splunk User Groups to connect and learn in-person by region or remotely by topic or industry.
Get Updates on the Splunk Community!
A Four-Part Event Series: Full Stack Observability For the AI Era
As AI reshapes applications, infrastructure, and the way teams operate, the traditional boundaries of ...
SOC4Kafka - New Kafka Connector Powered by OpenTelemetry
The new SOC4Kafka connector, built on OpenTelemetry, enables the collection of Kafka messages and forwards ...
Event Series: Level up your SOC: Advancing with Splunk Enterprise Security
AI has fundamentally raised the stakes for security operations, and this three-part series is your guide to ...
