
Join the Conversation
- Find Answers
- :
- Using Splunk
- :
- Splunk Search
- :
- How to get a column chart to show count between tw...
- Subscribe to RSS Feed
- Mark Topic as New
- Mark Topic as Read
- Float this Topic for Current User
- Bookmark Topic
- Subscribe to Topic
- Mute Topic
- Printer Friendly Page
- Mark as New
- Bookmark Message
- Subscribe to Message
- Mute Message
- Subscribe to RSS Feed
- Permalink
- Report Inappropriate Content

Hi everyone, hope u r all doing good.
So i have a query i am not able to figure out.I need to show a visualisation of column chart which shows each bar containing data between two dates. I'll explain it clearly.

As u can see in the picture i attached...it shows a timeline visualisation and data between two dates 6/9/2020-6/23/2020.
In the exact same way i want to show on a column chart. So that later if i add any data between those dates for ex. On 6/15/2020 and 6/16/2020 etc....and if i overlay it , it should show me a line chart on that column chart.I hope i am clear if not plz tell me.
So the query that I used for that timeline graph is:
Index= main sourcetype= timeline | rename "beginning_date" as start_date | rename "ending_date" as end_date | eval _time= strptime(start_date, "%m/%d/%Y") | eval end_time= strptime(end_date, "%m/%d/%Y") | eval duration = (end_time - _time) * 1000 | eval duration = IF(duration < 86400000, 0, duration) | stats count by _time, duration, "target" | table _time "target" durationso most of this query is from the timeline gallery example dashboard in Splunk. I don't think duration work with a column chart to show 6/9/2020-6/23/2020 format like this.
I have two fields
Beginning_date. Ending_date
6/9/2020. 6/23/2020
Like this and I need to show something like the below pic:

It would be really helpful if anyone could help me with this. Thanks.
- Mark as New
- Bookmark Message
- Subscribe to Message
- Mute Message
- Subscribe to RSS Feed
- Permalink
- Report Inappropriate Content

sample2:
| tstats count where index=_internal sourcetype!=splunkd*  earliest=1 by _time span=1d sourcetype
| stats sum(count) as count min(_time) as start max(_time) as end by sourcetype
| convert ctime(start) ctime(end) timeformat="%m/%d/%Y"
| eval times=start."-".end
| xyseries  times sourcetype count
- Mark as New
- Bookmark Message
- Subscribe to Message
- Mute Message
- Subscribe to RSS Feed
- Permalink
- Report Inappropriate Content
sample:
| tstats count where index=_internal sourcetype!=splunkd*  earliest=1 by _time span=1d sourcetype
| stats dc(sourcetype) as count by _time sourcetype
| xyseries _time sourcetype count
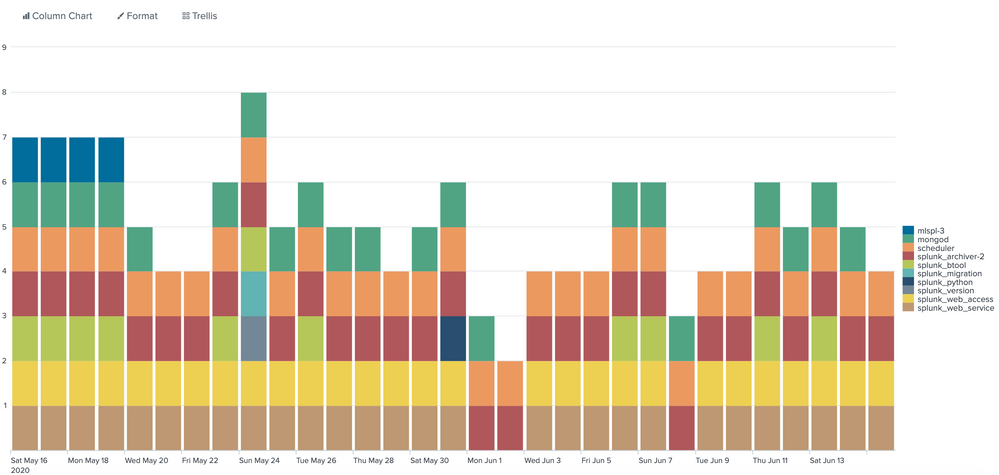
How about this image?
- Mark as New
- Bookmark Message
- Subscribe to Message
- Mute Message
- Subscribe to RSS Feed
- Permalink
- Report Inappropriate Content
Hi...i dnt think that is the way i want it to show. I have updated my question and added a pic ...plz check.
- Mark as New
- Bookmark Message
- Subscribe to Message
- Mute Message
- Subscribe to RSS Feed
- Permalink
- Report Inappropriate Content
sample2:
| tstats count where index=_internal sourcetype!=splunkd*  earliest=1 by _time span=1d sourcetype
| stats sum(count) as count min(_time) as start max(_time) as end by sourcetype
| convert ctime(start) ctime(end) timeformat="%m/%d/%Y"
| eval times=start."-".end
| xyseries  times sourcetype count
- Mark as New
- Bookmark Message
- Subscribe to Message
- Mute Message
- Subscribe to RSS Feed
- Permalink
- Report Inappropriate Content
Hi...ya this is working but one thing. Does this only work for _time , bcoz i have dates in a seperate field that i have created and if i give that field name it's not working. Or is it bcoz, i created that field so the dates are in a string format and not date format???can u plz help me with this
- Mark as New
- Bookmark Message
- Subscribe to Message
- Mute Message
- Subscribe to RSS Feed
- Permalink
- Report Inappropriate Content
Index= main sourcetype= timeline
| eval dates=beginning_date."-".ending_date
| stats count by dates, target
| xyseries dates target count
https://docs.splunk.com/Documentation/Splunk/latest/SearchReference/Eval
You can fix the rest.

Join the Splunk Community Slack to learn, troubleshoot, and make connections with fellow Splunk practitioners in real time!
Join Splunk User Groups to connect and learn in-person by region or remotely by topic or industry.
Agent Mode Engaged! Enchaining Agentic Operations with Splunk AI Assistant 2.0
Announcing Modern Navigation: A New Era of Splunk User Experience
Modernize your Splunk Apps – Introducing Python 3.13 in Splunk
