
Join the Conversation
- Find Answers
- :
- Using Splunk
- :
- Splunk Search
- :
- How to display multiple data points when hovering ...
- Subscribe to RSS Feed
- Mark Topic as New
- Mark Topic as Read
- Float this Topic for Current User
- Bookmark Topic
- Subscribe to Topic
- Mute Topic
- Printer Friendly Page
- Mark as New
- Bookmark Message
- Subscribe to Message
- Mute Message
- Subscribe to RSS Feed
- Permalink
- Report Inappropriate Content
How to display multiple data points when hovering on one data point on timechart line graph?

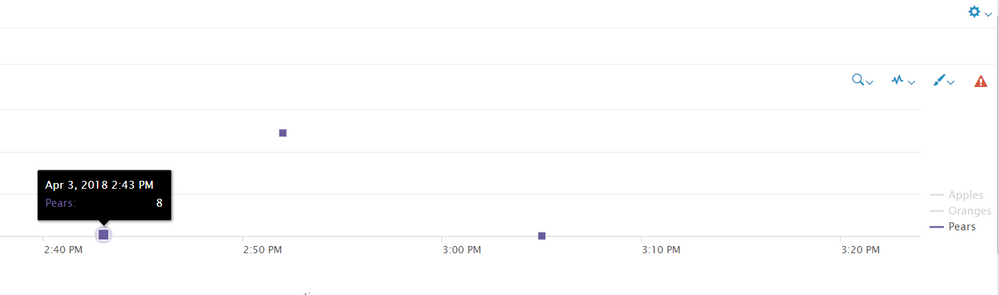
The issue I run into is if, at a given time, the # of apples, oranges and pears are all let's say 8, then it appears as one single point on the graph. Also, when you hover over the data point, you only see 1 of the data values, instead of all 3. I want to hover over a given data point at a given time and display all values that were logged at that time.
Search used for this theoretical example:
my_search | timechart sum(apples) as apples sum(oranges) as oranges sum(pears) as pears
Here is a screenshot:

- Mark as New
- Bookmark Message
- Subscribe to Message
- Mute Message
- Subscribe to RSS Feed
- Permalink
- Report Inappropriate Content

Hi bgeshK,
Could you please use column chart
Splunk visualization or dashboard provide two dimensional views with x axis and y axis. here time is in x axis and others values in y-axis.
actually your query is working when i modified and tried as follows
here i used only column chart but it working fine
| makeresults | eval apples=8 | append [ | makeresults | eval oranges=8 ] | append [ | makeresults | eval pears=8 ] | timechart sum(apples) as apples sum(oranges) as oranges sum(pears) as pears
you will see the result at the end of the chart with three colored line
- Mark as New
- Bookmark Message
- Subscribe to Message
- Mute Message
- Subscribe to RSS Feed
- Permalink
- Report Inappropriate Content
The problem with column chart is that in my real example, there will be 5 numbers at a time and it's not easy to tell if there's a discrepancy in the 5 numbers or not by just looking at the vertical bars because if the number is really high, it could look the same, but could be 1 or 2 values off
- Mark as New
- Bookmark Message
- Subscribe to Message
- Mute Message
- Subscribe to RSS Feed
- Permalink
- Report Inappropriate Content
There are only two ways
1) There is a option called trellis, please click that then "tick the 'use trellis layout' " it will show the result separately
OR
2) In Column chart: you can click the format option and click show data values "ON" after that you can see the values in the chart itself

Join the Splunk Community Slack to learn, troubleshoot, and make connections with fellow Splunk practitioners in real time!
Join Splunk User Groups to connect and learn in-person by region or remotely by topic or industry.
Make Your Machine Data AI-Ready in Splunk
Splunk Asynchronous Forwarding Explained
How to Monitor AI Agents with Splunk Agent Observability
