
Join the Conversation
- Find Answers
- :
- Using Splunk
- :
- Splunk Search
- :
- Re: Create Pie charts with column values
- Subscribe to RSS Feed
- Mark Topic as New
- Mark Topic as Read
- Float this Topic for Current User
- Bookmark Topic
- Subscribe to Topic
- Mute Topic
- Printer Friendly Page
- Mark as New
- Bookmark Message
- Subscribe to Message
- Mute Message
- Subscribe to RSS Feed
- Permalink
- Report Inappropriate Content

Hi guys, I am quite new to the Splunk world, pls forgive me for asking a very basic question.
So I have a table as following:
job_id total_passed total_failed total_not_run
9 14 20 6
10 25 31 9
and so on. I want to create a pie chart for different job_ids (lets say 9), with total_passed, total_failed, total_not_run values (14, 20, 6) and total_passed, total_failed, total_not_run as the headers of the chart in Splunk dashboard. how to do it? any help will be deeply appreciated.
- Mark as New
- Bookmark Message
- Subscribe to Message
- Mute Message
- Subscribe to RSS Feed
- Permalink
- Report Inappropriate Content


So, if you're only looking to show a pie chart for a single job_id, then you could do this
| makeresults
| eval _raw="job_id     total_passed        total_failed      total_not_run
9                14                           20                         6
10              25                            31                        9"
| multikv forceheader=1

| table job_id total_passed total_failed total_not_run
| where job_id=9
| transpose 0 header_field=job_id
The first part up to the '| table..' is creating your example.
The 'where' statement is just filtering only job_id 9
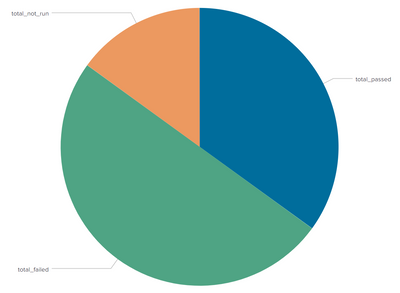
and the transpose statement converts columns to rows, so you will have 3 rows with the names/values and then the pie chart will look like this
- Mark as New
- Bookmark Message
- Subscribe to Message
- Mute Message
- Subscribe to RSS Feed
- Permalink
- Report Inappropriate Content
Thanks @bowesmana !
- Mark as New
- Bookmark Message
- Subscribe to Message
- Mute Message
- Subscribe to RSS Feed
- Permalink
- Report Inappropriate Content
Thanks a lot @bowesmana. Tried it, works like a charm!
1 follow up question on this, how can I change the colour of the pie chart sections and the name of the fields shown on the pie chart section (instead of total_passed, I would like to see Total Passed).
Thanks a lot mate for helping me out here!
- Mark as New
- Bookmark Message
- Subscribe to Message
- Mute Message
- Subscribe to RSS Feed
- Permalink
- Report Inappropriate Content
Here's an example dashboard showing the rename and setting the colours.
In the XML you can see charting.fieldColors option to set the colours
<dashboard>
  <label>tst1</label>
  <row>
    <panel>
      <chart>
        <search>
          <query>| makeresults
| eval _raw="job_id     total_passed        total_failed      total_not_run
9                14                           20                         6
10              25                            31                        9"
| multikv forceheader=1

| table job_id total_passed total_failed total_not_run
| where job_id=9
| rename total_passed as "Total Passed" total_failed as "Total Failed" total_not_run as "Total not Run"
| transpose 0 header_field=job_id</query>
          <earliest>-24h@h</earliest>
          <latest>now</latest>
          <sampleRatio>1</sampleRatio>
        </search>
        <option name="charting.chart">pie</option>
        <option name="charting.drilldown">none</option>
        <option name="refresh.display">progressbar</option>
        <option name="charting.fieldColors">
          {"Total Failed": 0xFF0000, "Total not Run": 0xFF9900, "Total Passed":0x009900, "NULL":0xC4C4C0}
        </option>
      </chart>
    </panel>
  </row>
</dashboard>
- Mark as New
- Bookmark Message
- Subscribe to Message
- Mute Message
- Subscribe to RSS Feed
- Permalink
- Report Inappropriate Content
So, if you're only looking to show a pie chart for a single job_id, then you could do this
| makeresults
| eval _raw="job_id     total_passed        total_failed      total_not_run
9                14                           20                         6
10              25                            31                        9"
| multikv forceheader=1

| table job_id total_passed total_failed total_not_run
| where job_id=9
| transpose 0 header_field=job_id
The first part up to the '| table..' is creating your example.
The 'where' statement is just filtering only job_id 9
and the transpose statement converts columns to rows, so you will have 3 rows with the names/values and then the pie chart will look like this


Join the Splunk Community Slack to learn, troubleshoot, and make connections with fellow Splunk practitioners in real time!
Join Splunk User Groups to connect and learn in-person by region or remotely by topic or industry.
Vibe-coding, AI, and Splunkcraft: Highlights from the .conf26 Builder Bar
Thanks for the Memories: .conf26 Took Learning to New Heights
Best Practices: Splunk auto adjust pipeline queue
