
Join the Conversation
- Find Answers
- :
- Using Splunk
- :
- Splunk Search
- :
- How to create column chart?
- Subscribe to RSS Feed
- Mark Topic as New
- Mark Topic as Read
- Float this Topic for Current User
- Bookmark Topic
- Subscribe to Topic
- Mute Topic
- Printer Friendly Page
- Mark as New
- Bookmark Message
- Subscribe to Message
- Mute Message
- Subscribe to RSS Feed
- Permalink
- Report Inappropriate Content

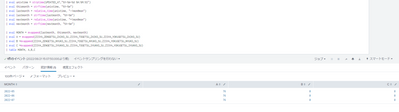
I created this data table by "mvappend" command.
dont have "_time" column and have only 3months records.
MONTH itemA itemB itemC
|
2022-05
2022-06
2022-07
|
1
2
3
|
4
5
6
|
7
8
9
|
I want to create a column chart : x-axis : MONTH , y-axis : value
from this data table.
But I cant by using "chart" command.
Please let me know how to create.
Sorry if there are any mistakes in this sentence.
- Mark as New
- Bookmark Message
- Subscribe to Message
- Mute Message
- Subscribe to RSS Feed
- Permalink
- Report Inappropriate Content


@SCSC - That's because everything is multi-value fields. It needs to be separated. Use the following commands at the end of your query:
| eval all_fields = mvzip(MONTH, mvzip(A, mvzip(B, C, "|"), "|"), "|")
| | fields all_fields | mvexpand all_fields
| rex field=all_fields "(?<MONTH>[^\|]+)\|(?<A>[^\|]+)\|(?<B>[^\|]+)\|(?<C>.+)"
| fields - all_fields
I hope this helps!!!
- Mark as New
- Bookmark Message
- Subscribe to Message
- Mute Message
- Subscribe to RSS Feed
- Permalink
- Report Inappropriate Content
@SCSC - Your data is already in the correct format. (month on x-axis => first column, everything else for Y-axis). Hence you don't need to use a chart or any other command.
Once you see your data (in the statistics tab) in the format that you have here, you can just use the Visualization tab and select the column chart.
I hope this helps!!!
- Mark as New
- Bookmark Message
- Subscribe to Message
- Mute Message
- Subscribe to RSS Feed
- Permalink
- Report Inappropriate Content
Thanks for reply.
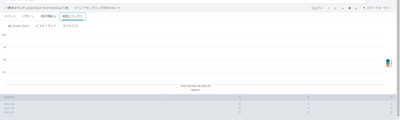
I think so too, but I cant make column chart....
- Mark as New
- Bookmark Message
- Subscribe to Message
- Mute Message
- Subscribe to RSS Feed
- Permalink
- Report Inappropriate Content
@SCSC - That's because everything is multi-value fields. It needs to be separated. Use the following commands at the end of your query:
| eval all_fields = mvzip(MONTH, mvzip(A, mvzip(B, C, "|"), "|"), "|")
| | fields all_fields | mvexpand all_fields
| rex field=all_fields "(?<MONTH>[^\|]+)\|(?<A>[^\|]+)\|(?<B>[^\|]+)\|(?<C>.+)"
| fields - all_fields
I hope this helps!!!
- Mark as New
- Bookmark Message
- Subscribe to Message
- Mute Message
- Subscribe to RSS Feed
- Permalink
- Report Inappropriate Content
I've solved the problem !
Thank you very much !!!:-)

Join the Splunk Community Slack to learn, troubleshoot, and make connections with fellow Splunk practitioners in real time!
Join Splunk User Groups to connect and learn in-person by region or remotely by topic or industry.
Meet the .conf26 AI Agent Buildathon Winners
Trusted Autonomy in the SOC: A Maturity Journey
Supercharging Windows Security Detection Performance: Introducing Hybrid Field ...
