
Join the Conversation
- Find Answers
- :
- Using Splunk
- :
- Splunk Search
- :
- Re: How to chart multiple fields over time on one ...
- Subscribe to RSS Feed
- Mark Topic as New
- Mark Topic as Read
- Float this Topic for Current User
- Bookmark Topic
- Subscribe to Topic
- Mute Topic
- Printer Friendly Page
- Mark as New
- Bookmark Message
- Subscribe to Message
- Mute Message
- Subscribe to RSS Feed
- Permalink
- Report Inappropriate Content

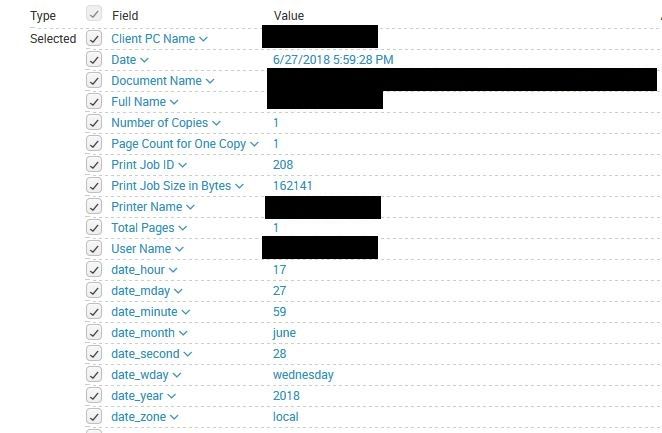
Using the base search listed below it presents me with all print jobs, one print job per user. I would like to chart the fields "Total Pages" by "Full Name" for all users(all results) over time on one graph. In total there are around 37 users and several random "Total Page" counts. Thinking of using a line graph. What would be the best way to complete this?
I then would like to create a table that totals all pages printed by user. So adding the "Total Pages" field, by "Full Name" in a table.
Base Search:
index="win_custom" sourcetype="print-job-accounting-report"
Thank you!
- Mark as New
- Bookmark Message
- Subscribe to Message
- Mute Message
- Subscribe to RSS Feed
- Permalink
- Report Inappropriate Content

Hi @cpalicensing,
Does this work for you ?
Chart
index="win_custom" sourcetype="print-job-accounting-report"|timechart span=1d values("Total Pages") by "Full Name"
If this doesn't fit , please let us know what aggregation you want to do on "Total Pages". Also adjust the span min,day,hour etc
Table
index="win_custom" sourcetype="print-job-accounting-report"|stats sum("Total Pages") by "Full Name"
What goes around comes around. If it helps, hit it with Karma 🙂
- Mark as New
- Bookmark Message
- Subscribe to Message
- Mute Message
- Subscribe to RSS Feed
- Permalink
- Report Inappropriate Content
Hi @cpalicensing,
Does this work for you ?
Chart
index="win_custom" sourcetype="print-job-accounting-report"|timechart span=1d values("Total Pages") by "Full Name"
If this doesn't fit , please let us know what aggregation you want to do on "Total Pages". Also adjust the span min,day,hour etc
Table
index="win_custom" sourcetype="print-job-accounting-report"|stats sum("Total Pages") by "Full Name"
What goes around comes around. If it helps, hit it with Karma 🙂



Join the Splunk Community Slack to learn, troubleshoot, and make connections with fellow Splunk practitioners in real time!
Join Splunk User Groups to connect and learn in-person by region or remotely by topic or industry.
Cisco Data Fabric from Architecture to Investigation, Better SOC Visibility, and More ...
The Trust Gap: Why a Data Foundation is Fundamental to an Agentic Enterprise
Data Management Digest – September 2026
