Turn on suggestions
Auto-suggest helps you quickly narrow down your search results by suggesting possible matches as you type.
Splunk Search
×
Join the Conversation
Without signing in, you're just watching from the sidelines. Sign in or Register to connect, share, and be part of the Splunk Community.
- Find Answers
- :
- Using Splunk
- :
- Splunk Search
- :
- How to change timechart axis?
Options
- Subscribe to RSS Feed
- Mark Topic as New
- Mark Topic as Read
- Float this Topic for Current User
- Bookmark Topic
- Subscribe to Topic
- Mute Topic
- Printer Friendly Page
- Mark as New
- Bookmark Message
- Subscribe to Message
- Mute Message
- Subscribe to RSS Feed
- Permalink
- Report Inappropriate Content
How to change timechart axis?
corehan
Explorer
04-19-2022
06:02 AM
- Mark as New
- Bookmark Message
- Subscribe to Message
- Mute Message
- Subscribe to RSS Feed
- Permalink
- Report Inappropriate Content
corehan
Explorer
04-25-2022
03:24 AM
- Mark as New
- Bookmark Message
- Subscribe to Message
- Mute Message
- Subscribe to RSS Feed
- Permalink
- Report Inappropriate Content
ITWhisperer

SplunkTrust
04-19-2022
07:12 AM
| xyseries Xaxis _time Yaxis- Mark as New
- Bookmark Message
- Subscribe to Message
- Mute Message
- Subscribe to RSS Feed
- Permalink
- Report Inappropriate Content
VatsalJagani
SplunkTrust
04-19-2022
06:52 AM
@corehan - Why you are using untable command?
By default timechart command put _time on the X-axis. Please try removing stuff after sort command and see if you get what you need.
-----
I hope this helps!!! If it does consider upvoting!!!
- Mark as New
- Bookmark Message
- Subscribe to Message
- Mute Message
- Subscribe to RSS Feed
- Permalink
- Report Inappropriate Content
corehan
Explorer
04-19-2022
06:59 AM
- Mark as New
- Bookmark Message
- Subscribe to Message
- Mute Message
- Subscribe to RSS Feed
- Permalink
- Report Inappropriate Content
VatsalJagani
SplunkTrust
04-19-2022
07:11 AM
@corehan - Since you are using timechart command with groupby, your Y-axis field name is not the "count".
If you look at the results it's not one-dimensional results here. So if you want to filter for those for which the total count is not greater than 3 then you can use the following search:
<base search> | timechart span=1h count(REQUESTNAME) by ilce
| transpose
| addtotals
| search Total>3
| fields- Total
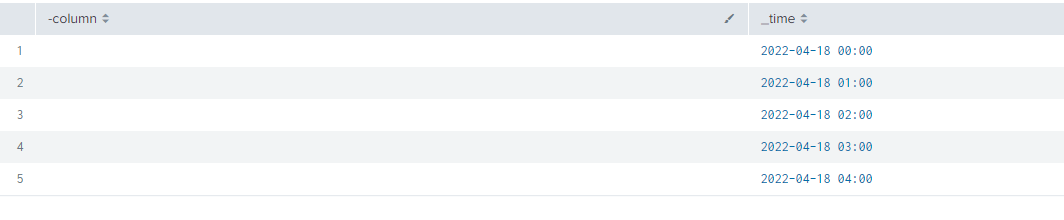
| transpose header_field=column
| fields - column
Please post the screenshot of the result if this does not work.
- Mark as New
- Bookmark Message
- Subscribe to Message
- Mute Message
- Subscribe to RSS Feed
- Permalink
- Report Inappropriate Content
corehan
Explorer
04-19-2022
08:52 AM

Got questions? Get answers!
Join the Splunk Community Slack to learn, troubleshoot, and make connections with fellow Splunk practitioners in real time!
Meet up IRL or virtually!
Join Splunk User Groups to connect and learn in-person by region or remotely by topic or industry.
Get Updates on the Splunk Community!
From Data to Insight: Announcing the Winners of the Splunk Dashboard Contest
Hi Splunkers,
First off, thank you to everyone who participated in our very first From Data to Insight: The ...
Splunk Developers: Construct Your Future at the .conf26 Builder Bar
Calling all Splunk architects, platform admins, and app developers: the site is open, and the blueprints are ...
Quick connection discovery mode for forwarders
When a Splunk forwarder loses connectivity to its indexers, it does not always reconnect immediately. In many ...
