
Join the Conversation
- Find Answers
- :
- Using Splunk
- :
- Splunk Search
- :
- Re: Breakdown Errors in Charts
- Subscribe to RSS Feed
- Mark Topic as New
- Mark Topic as Read
- Float this Topic for Current User
- Bookmark Topic
- Subscribe to Topic
- Mute Topic
- Printer Friendly Page
- Mark as New
- Bookmark Message
- Subscribe to Message
- Mute Message
- Subscribe to RSS Feed
- Permalink
- Report Inappropriate Content

Hello - I am a new Splunk user and learning as I go. My current task is to breakdown Errors/Exceptions in chart group by error codes in error tables or list.
current query: My current query only returns null values.
index= (index name) host=(hostname)
| timechart count by error
- Mark as New
- Bookmark Message
- Subscribe to Message
- Mute Message
- Subscribe to RSS Feed
- Permalink
- Report Inappropriate Content

Hi @Khanu89
For your pie-chart, in the xml code add the following option configuration.
<option name="charting.chart.showPercent">1</option>
You should be able to see the percentage details against each category in the chart.
Something like below.
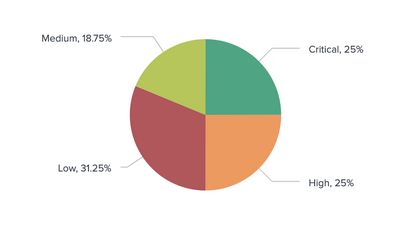
If it helps, Karma vote is appreciated
- Mark as New
- Bookmark Message
- Subscribe to Message
- Mute Message
- Subscribe to RSS Feed
- Permalink
- Report Inappropriate Content
Hi @Khanu89
For your pie-chart, in the xml code add the following option configuration.
<option name="charting.chart.showPercent">1</option>
You should be able to see the percentage details against each category in the chart.
Something like below.
If it helps, Karma vote is appreciated
- Mark as New
- Bookmark Message
- Subscribe to Message
- Mute Message
- Subscribe to RSS Feed
- Permalink
- Report Inappropriate Content


It sounds like error is not a field that has been extracted from your events.
Can you share some sample events, assuming you need help extracting the error field?
- Mark as New
- Bookmark Message
- Subscribe to Message
- Mute Message
- Subscribe to RSS Feed
- Permalink
- Report Inappropriate Content
Here is a example from my dashboard.

- Mark as New
- Bookmark Message
- Subscribe to Message
- Mute Message
- Subscribe to RSS Feed
- Permalink
- Report Inappropriate Content
What fields do you already have extracted?
You don't appear to have a field called error (note that field names are case sensitive).
Assuming that the fields that appear to be in your event, you could try
| stats count by ErrorCode- Mark as New
- Bookmark Message
- Subscribe to Message
- Mute Message
- Subscribe to RSS Feed
- Permalink
- Report Inappropriate Content
@ITWhisperer I am running the following which breaks down different categories but how can I break down the Error type to percentage of errors such as 20% 404, 15% 503 etc..
index=epic_ehr
|stats count by Type



Join the Splunk Community Slack to learn, troubleshoot, and make connections with fellow Splunk practitioners in real time!
Join Splunk User Groups to connect and learn in-person by region or remotely by topic or industry.
Agentic SOC Triage: Investigating Splunk ES Notables with MCP Server and a Local LLM
All Work and No Play? Not at .conf26! Unwind at These Evening Events
Join the Hackathon at .conf26 and build a No-Code AI agent
