Join the Conversation
- Find Answers
- :
- Using Splunk
- :
- Splunk Search
- :
- How to breakdown errors in charts group by error c...
- Subscribe to RSS Feed
- Mark Topic as New
- Mark Topic as Read
- Float this Topic for Current User
- Bookmark Topic
- Subscribe to Topic
- Mute Topic
- Printer Friendly Page
- Mark as New
- Bookmark Message
- Subscribe to Message
- Mute Message
- Subscribe to RSS Feed
- Permalink
- Report Inappropriate Content
Hello - I am a new Splunk user and learning as I go. My current task is to breakdown Errors/Exceptions in chart group by error codes in error tables or list.
current query: My current query only returns null values.
index= (index name) host=(hostname)
| timechart count by error
- Mark as New
- Bookmark Message
- Subscribe to Message
- Mute Message
- Subscribe to RSS Feed
- Permalink
- Report Inappropriate Content
Hi @Khanu89
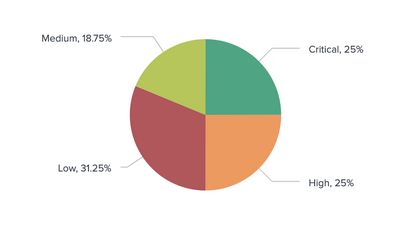
For your pie-chart, in the xml code add the following option configuration.
<option name="charting.chart.showPercent">1</option>
You should be able to see the percentage details against each category in the chart.
Something like below.
If it helps, Karma vote is appreciated
- Mark as New
- Bookmark Message
- Subscribe to Message
- Mute Message
- Subscribe to RSS Feed
- Permalink
- Report Inappropriate Content
It sounds like error is not a field that has been extracted from your events.
Can you share some sample events, assuming you need help extracting the error field?
- Mark as New
- Bookmark Message
- Subscribe to Message
- Mute Message
- Subscribe to RSS Feed
- Permalink
- Report Inappropriate Content
Here is a example from my dashboard.
- Mark as New
- Bookmark Message
- Subscribe to Message
- Mute Message
- Subscribe to RSS Feed
- Permalink
- Report Inappropriate Content
What fields do you already have extracted?
You don't appear to have a field called error (note that field names are case sensitive).
Assuming that the fields that appear to be in your event, you could try
| stats count by ErrorCode- Mark as New
- Bookmark Message
- Subscribe to Message
- Mute Message
- Subscribe to RSS Feed
- Permalink
- Report Inappropriate Content
@ITWhisperer I am running the following which breaks down different categories but how can I break down the Error type to percentage of errors such as 20% 404, 15% 503 etc..
index=epic_ehr
|stats count by Type


