
Join the Conversation
- Find Answers
- :
- Using Splunk
- :
- Splunk Search
- :
- Re: How to adjust chart column width?
- Subscribe to RSS Feed
- Mark Topic as New
- Mark Topic as Read
- Float this Topic for Current User
- Bookmark Topic
- Subscribe to Topic
- Mute Topic
- Printer Friendly Page
- Mark as New
- Bookmark Message
- Subscribe to Message
- Mute Message
- Subscribe to RSS Feed
- Permalink
- Report Inappropriate Content

Hi,
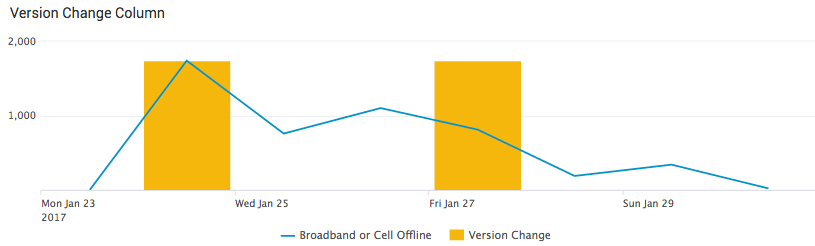
I have the below panel. What I'm looking to do is to make the columns in this graph "skinny" (5 pixels or less) so that it can represent an event in time. I've seen answers on Splunk answers that refer to advanced XML (haven't done this before), or sprites (also haven't done this before). If I need to use one of those methods could you walk me thru how?

- Mark as New
- Bookmark Message
- Subscribe to Message
- Mute Message
- Subscribe to RSS Feed
- Permalink
- Report Inappropriate Content


Try playing around with the charting.chart.columnSpacing setting for the bar chart.
For example, I opened up the source for a bar chart with overlay that I had set up. By adding the 'charting.chart.columnSpacing' option and setting it really high (100 in my case) it crunched down the bards to nearly a single pixel depending on how wide I have my browser window scaled within my desktop's resolution.
....
<option name="charting.legend.labelStyle.overflowMode">ellipsisMiddle</option>
        <option name="charting.legend.placement">right</option>
        <option name="charting.chart.columnSpacing">100</option>
      </chart>
....
A similar question was asked on answers as well, here
- Mark as New
- Bookmark Message
- Subscribe to Message
- Mute Message
- Subscribe to RSS Feed
- Permalink
- Report Inappropriate Content
Try playing around with the charting.chart.columnSpacing setting for the bar chart.
For example, I opened up the source for a bar chart with overlay that I had set up. By adding the 'charting.chart.columnSpacing' option and setting it really high (100 in my case) it crunched down the bards to nearly a single pixel depending on how wide I have my browser window scaled within my desktop's resolution.
....
<option name="charting.legend.labelStyle.overflowMode">ellipsisMiddle</option>
        <option name="charting.legend.placement">right</option>
        <option name="charting.chart.columnSpacing">100</option>
      </chart>
....
A similar question was asked on answers as well, here
- Mark as New
- Bookmark Message
- Subscribe to Message
- Mute Message
- Subscribe to RSS Feed
- Permalink
- Report Inappropriate Content

Thank you. Its worked for me.
- Mark as New
- Bookmark Message
- Subscribe to Message
- Mute Message
- Subscribe to RSS Feed
- Permalink
- Report Inappropriate Content
That worked! And that was Genius!!! Thank you Pgreer!!!
If you will convert your comment to an answer I'll go ahead and accept.
Thanks again!
- Mark as New
- Bookmark Message
- Subscribe to Message
- Mute Message
- Subscribe to RSS Feed
- Permalink
- Report Inappropriate Content
done! Glad it worked out for you.
- Mark as New
- Bookmark Message
- Subscribe to Message
- Mute Message
- Subscribe to RSS Feed
- Permalink
- Report Inappropriate Content
It actually determines the space between the bars in the charts. is there a way we can actually set the width of a column?

Join the Splunk Community Slack to learn, troubleshoot, and make connections with fellow Splunk practitioners in real time!
Join Splunk User Groups to connect and learn in-person by region or remotely by topic or industry.
Meet the .conf26 AI Agent Buildathon Winners
Trusted Autonomy in the SOC: A Maturity Journey
Supercharging Windows Security Detection Performance: Introducing Hybrid Field ...
