Join the Conversation
- Find Answers
- :
- Using Splunk
- :
- Splunk Search
- :
- How to achieve a non numeric scatter plot on x and...
- Subscribe to RSS Feed
- Mark Topic as New
- Mark Topic as Read
- Float this Topic for Current User
- Bookmark Topic
- Subscribe to Topic
- Mute Topic
- Printer Friendly Page
- Mark as New
- Bookmark Message
- Subscribe to Message
- Mute Message
- Subscribe to RSS Feed
- Permalink
- Report Inappropriate Content
How to achieve a non numeric scatter plot on x and y?
Hi,
I have two text columns finding_id and device manufacturer, and a count of events containing both.
I'd like a scatter chart of device.manufacturer on the y-axis, and finding_id on the x-axis, but everything seems to revert to a numerical axis?
Am I missing something?
The below is from the stats page:
count   finding_id  device.manufacturer
9       V-3086      Cisco
9       V-3034      Cisco
9       V-14717    Cisco
9       V-14667    Cisco
8       V-5618      Cisco
- Mark as New
- Bookmark Message
- Subscribe to Message
- Mute Message
- Subscribe to RSS Feed
- Permalink
- Report Inappropriate Content
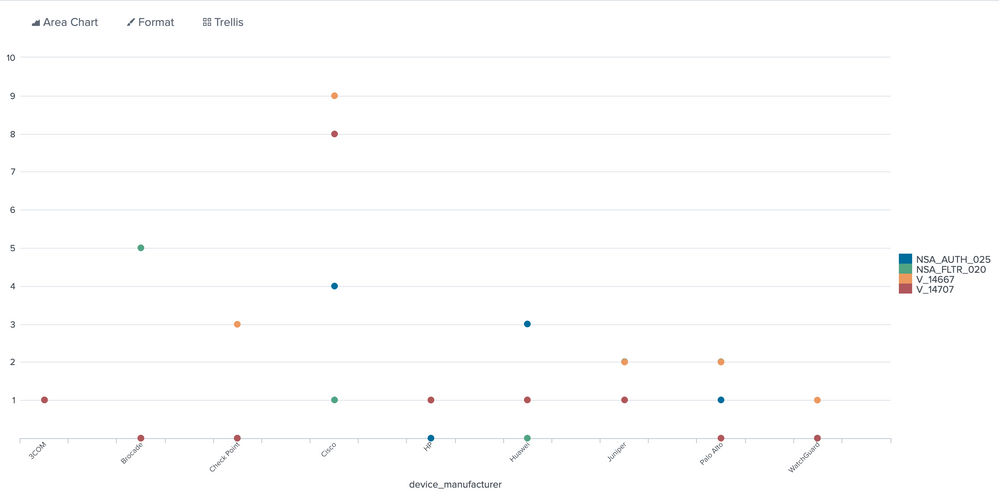
| makeresults
| eval _raw="device.manufacturer,NSA-AUTH-025,NSA-FLTR-020,V-14667,V-14707
3COM,1,1,1,1
Brocade,0,5,0,0
Check Point,0,0,3,0
Cisco,4,1,9,8
HP,0,1,1,1
Huawei,3,0,1,1
Juniper,2,2,2,1
Palo Alto,1,2,2,0
WatchGuard,0,0,1,0"
| multikv forceheader=1
| fields - _* linecount
| table device_manufacturer,NSA_AUTH_025,NSA_FLTR_020,V_14667,V_14707
| eval test=mvrange(0,2)
| mvexpand test
| streamstats count
| eval device_manufacturer=if(count % 2 = 0 , null(), device_manufacturer)
| foreach * [ eval <<FIELD>> = if(isnull(device_manufacturer),NULL,'<<FIELD>>')]
| fields - test count
I use trick.
try Viz>>Area Chart with Format Null Values=Gap
- Mark as New
- Bookmark Message
- Subscribe to Message
- Mute Message
- Subscribe to RSS Feed
- Permalink
- Report Inappropriate Content
Just use the chart command.
| chart count by finding_id device.manufacturer
Flip the order of the by fields if you want them the other way.
- Mark as New
- Bookmark Message
- Subscribe to Message
- Mute Message
- Subscribe to RSS Feed
- Permalink
- Report Inappropriate Content
Thanks. Unfortunately that didnt work.
My query is now
| chart count by finding_id ,device.manufacturer
Statistics tab now shows the below, but the scatter plot X and Y axis labels are NSA-FLTR-20 and V-14707, and each axis is still numerical
What I'd like is that the Y axis is a list of all devices, the X axis is a list of all findings, and the scatter plot shows counts at the intersection of the two
device.manufacturer NSA-AUTH-025 NSA-FLTR-020 V-14667 V-14707
3COM 1 1 1 1
Brocade 0 5 0 0
Check Point 0 0 3 0
Cisco 4 1 9 8
HP 0 1 1 1
Huawei 3 0 1 1
Juniper 2 2 2 1
Palo Alto 1 2 2 0
WatchGuard 0 0 1 0
But scatter chart is still using

