
Join the Conversation
- Find Answers
- :
- Using Splunk
- :
- Splunk Search
- :
- Re: How do you calculate the difference between tw...
- Subscribe to RSS Feed
- Mark Topic as New
- Mark Topic as Read
- Float this Topic for Current User
- Bookmark Topic
- Subscribe to Topic
- Mute Topic
- Printer Friendly Page
- Mark as New
- Bookmark Message
- Subscribe to Message
- Mute Message
- Subscribe to RSS Feed
- Permalink
- Report Inappropriate Content

How do you calculate the difference between two specific values in the same field and return that value in a percent format? I then need to be able to timechart that percentage difference over time, for my example this would be
conversion rate % span 1h
I've seen a few eval calculation example but none that gave me the output I'm looking for
index=example event="Entered Site" OR event="Checkout"
| top event
| eval percent = round(percent, 2)
- Mark as New
- Bookmark Message
- Subscribe to Message
- Mute Message
- Subscribe to RSS Feed
- Permalink
- Report Inappropriate Content

Is it like this?
 index=example event="Entered Site" OR event="Checkout"
 | timechart span=1h count(eval(event="Entered Site")) as Entered,count(eval(event="Checkout")) as Checkout
 | eval percent=round(Checkout/Entered,2)
 | table _time,percent
- Mark as New
- Bookmark Message
- Subscribe to Message
- Mute Message
- Subscribe to RSS Feed
- Permalink
- Report Inappropriate Content
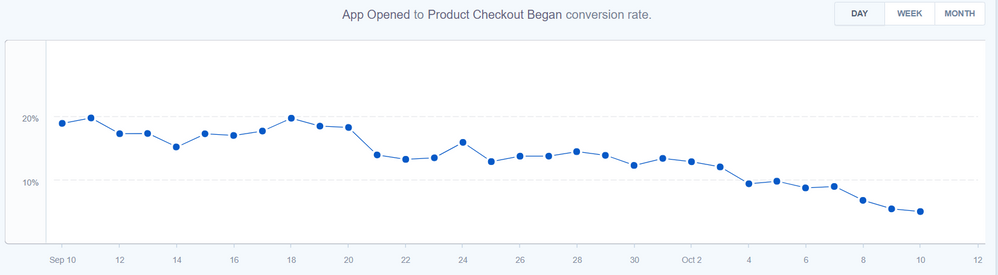
@HiroshiSatoh I'm trying to essentially reproduce the graph below that I have in an application called Mixpanel. I've onboarded the data to Splunk and the field I'm looking to visualization is called "event". In the event there are values called "App Opened" and "Product Checkout Began". I would like to know how you can calculate the % of Product Checkout Began from the total of App Opened and then timechart that % over time. For Example what is my conversion rate % per hour.

- Mark as New
- Bookmark Message
- Subscribe to Message
- Mute Message
- Subscribe to RSS Feed
- Permalink
- Report Inappropriate Content
The answer was corrected.
- Mark as New
- Bookmark Message
- Subscribe to Message
- Mute Message
- Subscribe to RSS Feed
- Permalink
- Report Inappropriate Content
Is it like this?
 index=example event="Entered Site" OR event="Checkout"
 | timechart span=1h count(eval(event="Entered Site")) as Entered,count(eval(event="Checkout")) as Checkout
 | eval percent=round(Checkout/Entered,2)
 | table _time,percent

Join the Splunk Community Slack to learn, troubleshoot, and make connections with fellow Splunk practitioners in real time!
Join Splunk User Groups to connect and learn in-person by region or remotely by topic or industry.
Make Your Machine Data AI-Ready in Splunk
Splunk Asynchronous Forwarding Explained
How to Monitor AI Agents with Splunk Agent Observability
