
Join the Conversation
- Find Answers
- :
- Using Splunk
- :
- Splunk Search
- :
- Getting Data into Splunk
- Subscribe to RSS Feed
- Mark Topic as New
- Mark Topic as Read
- Float this Topic for Current User
- Bookmark Topic
- Subscribe to Topic
- Mute Topic
- Printer Friendly Page
- Mark as New
- Bookmark Message
- Subscribe to Message
- Mute Message
- Subscribe to RSS Feed
- Permalink
- Report Inappropriate Content
Getting Data into Splunk

I just installed splunk and imported my license.
I have a series of Windows event viewer files that have been exported that I want to import.
I have tried the following:
- Settings --> Add Data
- Upload Files From My computer
- Select the file. It reads the file.
- Next
- Select Preprocess-winevt
- Next
- Review
- Submit
- Start Searching
No events are shown.
What am I doing wrong?
- Mark as New
- Bookmark Message
- Subscribe to Message
- Mute Message
- Subscribe to RSS Feed
- Permalink
- Report Inappropriate Content
I figured it out. After the process is complete the Search window has host="xxxx" and sourcetype="preprocess-winevt".
If I delete host="xxxx" and sourcetype="preprocess-winevt". events are shown.
- Mark as New
- Bookmark Message
- Subscribe to Message
- Mute Message
- Subscribe to RSS Feed
- Permalink
- Report Inappropriate Content


I hope checked in all time range and playing with search also.
Just guessing the reason and I doubt on retention period of Index. Just check the possible _time of indexed event and index retention period.
- Mark as New
- Bookmark Message
- Subscribe to Message
- Mute Message
- Subscribe to RSS Feed
- Permalink
- Report Inappropriate Content
kamlesh,
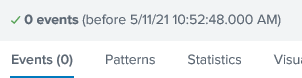
I think you are saying to make sure that I am specifying to show all events not just events in a specific time period. I did not select any time period and if I understand the interface correctly it is saying it sees no events prior to today at 10:52 There are 8198 events listed when I open the evtx file in Windows event viewer.


Join the Splunk Community Slack to learn, troubleshoot, and make connections with fellow Splunk practitioners in real time!
Join Splunk User Groups to connect and learn in-person by region or remotely by topic or industry.
Laser Bananas and Edge Hubs: Exploring Operational Technology (OT) Data Through a ...
Event Series: Mastering AI Tokenomics and Splunk Agent Observability
span_metrics: The OpenTelemetry-Idiomatic Way to See Inside Your Services
