
Join the Conversation
- Find Answers
- :
- Using Splunk
- :
- Splunk Search
- :
- Re: Display data on single bar line in chart
- Subscribe to RSS Feed
- Mark Topic as New
- Mark Topic as Read
- Float this Topic for Current User
- Bookmark Topic
- Subscribe to Topic
- Mute Topic
- Printer Friendly Page
- Mark as New
- Bookmark Message
- Subscribe to Message
- Mute Message
- Subscribe to RSS Feed
- Permalink
- Report Inappropriate Content


- Mark as New
- Bookmark Message
- Subscribe to Message
- Mute Message
- Subscribe to RSS Feed
- Permalink
- Report Inappropriate Content

hello @rvisj
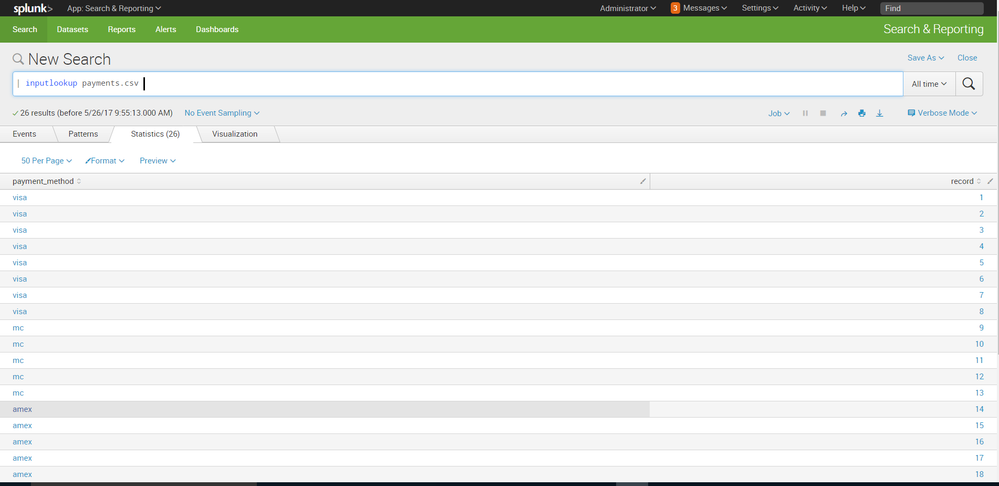
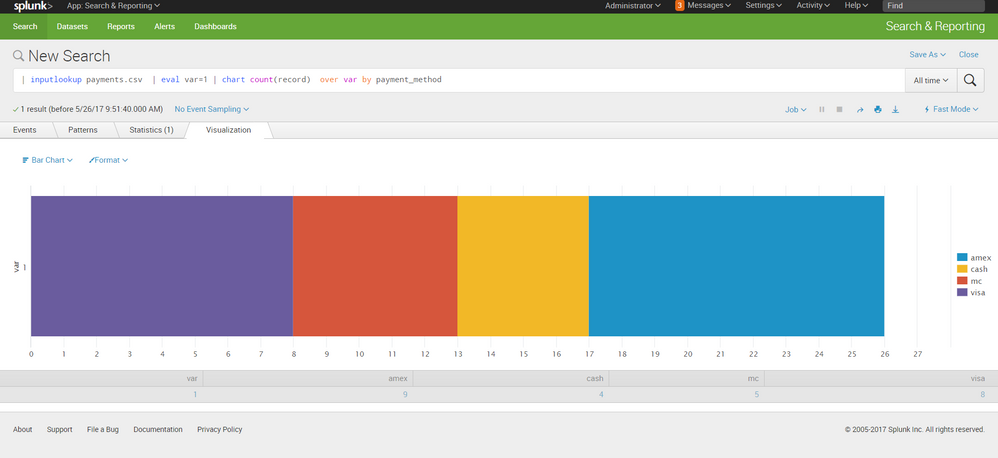
here i user an Instrumental Variable (... | eval var=1 )to use the chart command for the visualization you requested
in screenshot 1 you will see the lookup i created.
screenshot 2 has the search i used and bar chart
heres the search: | inputlookup payments.csv | eval var=1 | chart count(record) over var by payment_method
hope it helps
- Mark as New
- Bookmark Message
- Subscribe to Message
- Mute Message
- Subscribe to RSS Feed
- Permalink
- Report Inappropriate Content

Like this:
Your Base Search Here | eval label="Payment Methods" | contingency label "payment method" | search label!="TOTAL"
Set the visualization to Bar Chart and set the Stack Mode to the one on the right (stacked).
- Mark as New
- Bookmark Message
- Subscribe to Message
- Mute Message
- Subscribe to RSS Feed
- Permalink
- Report Inappropriate Content
thanks for your reply. I tried this but 'Total' is coming as a payment method and adding up in the chart
- Mark as New
- Bookmark Message
- Subscribe to Message
- Mute Message
- Subscribe to RSS Feed
- Permalink
- Report Inappropriate Content
Also add | fields - Total TOTAL to the end.
- Mark as New
- Bookmark Message
- Subscribe to Message
- Mute Message
- Subscribe to RSS Feed
- Permalink
- Report Inappropriate Content
hello @rvisj
here i user an Instrumental Variable (... | eval var=1 )to use the chart command for the visualization you requested
in screenshot 1 you will see the lookup i created.
screenshot 2 has the search i used and bar chart
heres the search: | inputlookup payments.csv | eval var=1 | chart count(record) over var by payment_method
hope it helps
- Mark as New
- Bookmark Message
- Subscribe to Message
- Mute Message
- Subscribe to RSS Feed
- Permalink
- Report Inappropriate Content
Working..thanks @adonio. Can we remover that 'var 1' label from Y-axis




Join the Splunk Community Slack to learn, troubleshoot, and make connections with fellow Splunk practitioners in real time!
Join Splunk User Groups to connect and learn in-person by region or remotely by topic or industry.
SOC4Kafka - New Kafka Connector Powered by OpenTelemetry
Rounding off the Splunk Dashboard Contest
A Four Part Event Series: AI + Observability: AI Agents, LLMs, Apps, & Infrastructure
