- Find Answers
- :
- Using Splunk
- :
- Splunk Search
- :
- Re: help with timeline viz needed
- Subscribe to RSS Feed
- Mark Topic as New
- Mark Topic as Read
- Float this Topic for Current User
- Bookmark Topic
- Subscribe to Topic
- Mute Topic
- Printer Friendly Page
- Mark as New
- Bookmark Message
- Subscribe to Message
- Mute Message
- Subscribe to RSS Feed
- Permalink
- Report Inappropriate Content
Hello,
I would like to achieve following:
- I have dashboard with the timeline vizualization and would like to get the duration of each of the steps either directly displayed on the graphic, let us say in the middle, or at least to give it additionally as an info in the tooltip.
At the moment the only thing in the tooltip is the start time and end time, from which the end user has to calculate the duration, which in my case is the key information.
How would I achieve this?
Kind Regards,
Kamil
- Mark as New
- Bookmark Message
- Subscribe to Message
- Mute Message
- Subscribe to RSS Feed
- Permalink
- Report Inappropriate Content
@damucka
Sample Query:
| makeresults
| eval raw = "Channel1%Show1%6:00:00 PM%7:00:00 PM;Channel1%Show2%7:00:00 PM%8:00:00 PM;Channel1%Show3%8:00:00 PM%9:00:00 PM;Channel2%ShowA%5:00:00 PM%6:00:00 PM;Channel2%ShowB%6:00:00 PM%6:30:00 PM;Channel2%ShowC%6:30:00 PM%8:00:00 PM;Channel3%ShowA%7:00:00 PM%8:00:00 PM;Channel3%ShowB%8:00:00 PM%8:30:00 PM;Channel3%ShowC%8:30:00 PM%9:00:00 PM"
| makemv raw delim=";"
| mvexpand raw
| rex field=raw "(?<Channel>[^\%]+)%(?<Show>[^\%]+)%(?<Start_Time>[^\%]+)%(?<Finish_Time>[^\%]+)"
| eval time_1 = strptime(Start_Time, "%H:%M:%S %p")
| eval time_2 = strptime(Finish_Time, "%H:%M:%S %p")
| eval duration = "Duration = ".round((time_2 - time_1)/3600, 1)." hr"
| eval group = Channel, label = Show, start = time_1, end = time_2, tooltip = Show."\n".duration
| makemv tooltip delim="\n"
| table group, label, start, end, tooltip
Result:
- Mark as New
- Bookmark Message
- Subscribe to Message
- Mute Message
- Subscribe to RSS Feed
- Permalink
- Report Inappropriate Content
Hi,
I have created a timeline of URLs hit over a given session.
Here is my chart:
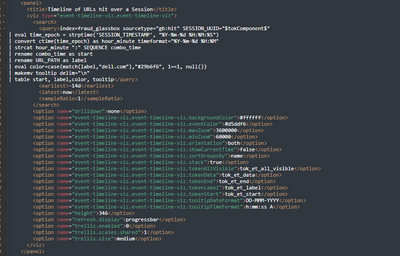
and here is the respective XML code:
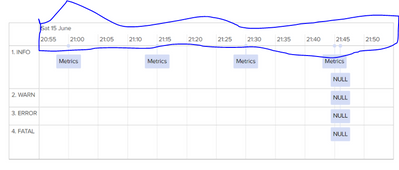
However, I need to add the time and dates on the top of the timeline as such:
How can I do this?
Many thanks,
Patrick
- Mark as New
- Bookmark Message
- Subscribe to Message
- Mute Message
- Subscribe to RSS Feed
- Permalink
- Report Inappropriate Content
@damucka
Sample Query:
| makeresults
| eval raw = "Channel1%Show1%6:00:00 PM%7:00:00 PM;Channel1%Show2%7:00:00 PM%8:00:00 PM;Channel1%Show3%8:00:00 PM%9:00:00 PM;Channel2%ShowA%5:00:00 PM%6:00:00 PM;Channel2%ShowB%6:00:00 PM%6:30:00 PM;Channel2%ShowC%6:30:00 PM%8:00:00 PM;Channel3%ShowA%7:00:00 PM%8:00:00 PM;Channel3%ShowB%8:00:00 PM%8:30:00 PM;Channel3%ShowC%8:30:00 PM%9:00:00 PM"
| makemv raw delim=";"
| mvexpand raw
| rex field=raw "(?<Channel>[^\%]+)%(?<Show>[^\%]+)%(?<Start_Time>[^\%]+)%(?<Finish_Time>[^\%]+)"
| eval time_1 = strptime(Start_Time, "%H:%M:%S %p")
| eval time_2 = strptime(Finish_Time, "%H:%M:%S %p")
| eval duration = "Duration = ".round((time_2 - time_1)/3600, 1)." hr"
| eval group = Channel, label = Show, start = time_1, end = time_2, tooltip = Show."\n".duration
| makemv tooltip delim="\n"
| table group, label, start, end, tooltip
Result:
- Mark as New
- Bookmark Message
- Subscribe to Message
- Mute Message
- Subscribe to RSS Feed
- Permalink
- Report Inappropriate Content
Hi @anmolpatel
Unfortunately when I copy / paste the example to my search window I get an error about the regex:
"Error in 'rex' command: Encountered the following error while compiling the regex '(?P[^\%]+)%(?P[^\%]+)%(?P[^\%]+)%(?P[^\%]+)': Regex: unrecognized character after (?P"
Also, the visualization looks a bit different from my Timeline one. Is it the standard timeline viz? Or you modified it?
At my side only the | table starttime, startup_phase, duration seems to show anything reasonable ...
- Mark as New
- Bookmark Message
- Subscribe to Message
- Mute Message
- Subscribe to RSS Feed
- Permalink
- Report Inappropriate Content
@damucka I've inserted the code using the sample code option, it should work now.
I've this timeline viz installed: event-timeline-viz 1.4.0
- Mark as New
- Bookmark Message
- Subscribe to Message
- Mute Message
- Subscribe to RSS Feed
- Permalink
- Report Inappropriate Content
Thank you.
I like the event-timeline-viz very much, it is so much better than the timeline, at least for me. Also my original issue could be addressed with your help.
One last question:
Is it possible to change the color of the bar but in case of specific label value?
I would like in some cases give the label "Restart phase not running" for some events and only for these set the color e.g. to yellow, that one can see at the first glance the difference.
Is it possible?
Kind Regards,
Kamil
- Mark as New
- Bookmark Message
- Subscribe to Message
- Mute Message
- Subscribe to RSS Feed
- Permalink
- Report Inappropriate Content
@damucka yes, that can be achieved. There are three ranges available: low (green color), elevated (yellow color), severe (red color). So if you've a column that has the condition to describe the color, you can set the range.
Here is an example where I've added the trigger condition to the tooltip itself:
| makeresults
 | eval raw = "Channel1%Show1%6:00:00 PM%7:00:00 PM;Channel1%Show2%7:00:00 PM%8:00:00 PM;Channel1%Show3%8:00:00 PM%9:00:00 PM;Channel2%ShowA%5:00:00 PM%6:00:00 PM;Channel2%ShowB%6:00:00 PM%6:30:00 PM;Channel2%ShowC%6:30:00 PM%8:00:00 PM;Channel3%ShowA%7:00:00 PM%8:00:00 PM;Channel3%ShowB%8:00:00 PM%8:30:00 PM;Channel3%ShowC%8:30:00 PM%9:00:00 PM"
 | makemv raw delim=";"
 | mvexpand raw
 | rex field=raw "(?<Channel>[^\%]+)%(?<Show>[^\%]+)%(?<Start_Time>[^\%]+)%(?<Finish_Time>[^\%]+)"
 | eval time_1 = strptime(Start_Time, "%H:%M:%S %p")
 | eval time_2 = strptime(Finish_Time, "%H:%M:%S %p")
 | eval duration = "Duration = ".round((time_2 - time_1)/3600, 1)." hr"
 | eval group = Channel, label = Show, start = time_1, end = time_2, tooltip = Show."\n".duration
 | eval tooltip =  if(group == "Channel1", tooltip + "\n" + "Restart phase not running", tooltip)
  | eval range = if(match(tooltip, ".*Restart phase not running"), "elevated", "low")
 | makemv tooltip delim="\n"
 | table group, label, start, end, tooltip, range
alternatively, you can set the range as the below, which will only highlight the restart phase: | eval range = case(match(tooltip, ".*Restart phase not running"), "elevated")
- Mark as New
- Bookmark Message
- Subscribe to Message
- Mute Message
- Subscribe to RSS Feed
- Permalink
- Report Inappropriate Content
@anmolpatel
Thank you for your input, it was really helpful.
Kind Regards,
Kamil
- Mark as New
- Bookmark Message
- Subscribe to Message
- Mute Message
- Subscribe to RSS Feed
- Permalink
- Report Inappropriate Content
@danspav ? maybe can help?
- Mark as New
- Bookmark Message
- Subscribe to Message
- Mute Message
- Subscribe to RSS Feed
- Permalink
- Report Inappropriate Content
What is your current search?
If this reply helps you, Karma would be appreciated.
- Mark as New
- Bookmark Message
- Subscribe to Message
- Mute Message
- Subscribe to RSS Feed
- Permalink
- Report Inappropriate Content
index=mlbso host="$host$" sourcetype=*_hanatraces source="*indexserver*" "==== Starting hdbindexserver" OR "Pre-/Re-Loading of column store tables finished"
| transaction host startswith="==== Starting hdbindexserver"  endswith="Pre-/Re-Loading of column store tables finished" maxspan=3600s
| eval starttime=strftime(_time,"%Y-%m-%d %H:%M:%S") | eval endtime=strftime(_time+duration,"%Y-%m-%d %H:%M:%S")
| eval startup_phase = "total"
| eval duration=round(duration)
| rex field=source "\/.+_(?P<DBSID>.+)\/(?P<service>.+)\_(?<filenameend>.+)$"
| table DBSID host starttime endtime startup_phase duration

| append

[ search
index=mlbso host="$host$" sourcetype=*_hanatraces source="*indexserver*" "*Logger*set restart info" OR "*Logger*REDO logging after log replay"
| transaction host startswith="*Logger*set restart info"  endswith="*Logger*REDO logging after log replay" maxspan=3600s
| eval starttime=strftime(_time,"%Y-%m-%d %H:%M:%S") | eval endtime=strftime(_time+duration,"%Y-%m-%d %H:%M:%S")
| eval startup_phase = "logger"
| eval duration=round(duration)
| rex field=source "\/.+_(?P<DBSID>.+)\/(?P<service>.+)\_(?<filenameend>.+)$"
| table DBSID host starttime endtime startup_phase duration
]

| append

[ search
index=mlbso host="$host$" sourcetype=*_hanatraces source="*indexserver*" PMRestart
| transaction host startswith="Initialize transient structures"  endswith="history cleanup file(s) finished" maxspan=3600s
| eval starttime=strftime(_time,"%Y-%m-%d %H:%M:%S") | eval endtime=strftime(_time+duration,"%Y-%m-%d %H:%M:%S")
| eval startup_phase = "pm"
| eval duration=round(duration)
| rex field=source "\/.+_(?P<DBSID>.+)\/(?P<service>.+)\_(?<filenameend>.+)$"
| table DBSID host starttime endtime startup_phase duration
]

| append

[ search
index=mlbso host="$host$" sourcetype=*_hanatraces source="*indexserver*" RowStorePageAcce
| transaction host  startswith="loadMultiplePageBlocksAtStartup" endswith="finished loading" maxspan=3600s
| eval starttime=strftime(_time,"%Y-%m-%d %H:%M:%S") | eval endtime=strftime(_time+duration,"%Y-%m-%d %H:%M:%S")
| eval startup_phase = "rowstore"
| eval duration=round(duration)
| rex field=source "\/.+_(?P<DBSID>.+)\/(?P<service>.+)\_(?<filenameend>.+)$"
| table DBSID host starttime endtime startup_phase duration
]

| append

[ search
index=mlbso host="$host$" sourcetype=*_hanatraces source="*indexserver*" TableReload OR Service_Startup
| transaction host  startswith="Starting reloading column store tables" endswith="Loading of column store tables finished" maxspan=3600s
| eval starttime=strftime(_time,"%Y-%m-%d %H:%M:%S") | eval endtime=strftime(_time+duration,"%Y-%m-%d %H:%M:%S")
| eval startup_phase = "cs_load"
| eval duration=round(duration)
| rex field=source "\/.+_(?P<DBSID>.+)\/(?P<service>.+)\_(?<filenameend>.+)$"
| table DBSID host starttime endtime startup_phase duration
]

| append

[ search
index=mlbso host="$host$" sourcetype=*_hanatraces source="*indexserver*" transmgmt
| transaction host  startswith="Transaction table initialized" endswith="Transaction manager initialization done" maxspan=3600s
| eval starttime=strftime(_time,"%Y-%m-%d %H:%M:%S") | eval endtime=strftime(_time+duration,"%Y-%m-%d %H:%M:%S")
| eval startup_phase = "transmgmt"
| eval duration=round(duration)
| rex field=source "\/.+_(?P<DBSID>.+)\/(?P<service>.+)\_(?<filenameend>.+)$"
| table DBSID host starttime endtime startup_phase duration
]

| eval duration = (duration * 1000)
| sort DBSID host starttime endtime
| table starttime startup_phase duration
- Mark as New
- Bookmark Message
- Subscribe to Message
- Mute Message
- Subscribe to RSS Feed
- Permalink
- Report Inappropriate Content
This is criminal and should be completely rewritten. It cannot possibly work at any scale without dropping data.
- Mark as New
- Bookmark Message
- Subscribe to Message
- Mute Message
- Subscribe to RSS Feed
- Permalink
- Report Inappropriate Content
All works actually fine, but I would like to present the duration on the timeline chart somehow (tooltip or on the bar directly) not that the users have to calculate it from start and and time
- Mark as New
- Bookmark Message
- Subscribe to Message
- Mute Message
- Subscribe to RSS Feed
- Permalink
- Report Inappropriate Content
Try to add following at the end of you current search.
your above search
| eval {startup_phase}=duration | fields - startup_phase duration
| table starttime *
- Mark as New
- Bookmark Message
- Subscribe to Message
- Mute Message
- Subscribe to RSS Feed
- Permalink
- Report Inappropriate Content
Hi @somesoni2
Unfortunately, it totally messed up the result. The timeline chart requires the table with the starttime, field (here:startup_phase) and duration as an input. And the above piece of code turns it into starttime and then the columns named with the values of the startup_phase having the values of the duration. On the chart it does not look as it should.
Please advice.
Kind Regards,
Kamil
- Mark as New
- Bookmark Message
- Subscribe to Message
- Mute Message
- Subscribe to RSS Feed
- Permalink
- Report Inappropriate Content
There seem to be an option to customize the tooltip for this visualization.
https://docs.splunk.com/Documentation/Timeline/1.3.0/TimelineViz/TimelineXML
Could you play around with that to show the duration on tooltip?
- Mark as New
- Bookmark Message
- Subscribe to Message
- Mute Message
- Subscribe to RSS Feed
- Permalink
- Report Inappropriate Content
| table starttime startup_phase duration
please provide this results.
and All works actually fine
there is many append and transaction. Is it true?
same index , sourcetype
I think append and transaction is not need.


