
Join the Conversation
- Find Answers
- :
- Using Splunk
- :
- Splunk Search
- :
- Concurrent calls per minute
- Subscribe to RSS Feed
- Mark Topic as New
- Mark Topic as Read
- Float this Topic for Current User
- Bookmark Topic
- Subscribe to Topic
- Mute Topic
- Printer Friendly Page
- Mark as New
- Bookmark Message
- Subscribe to Message
- Mute Message
- Subscribe to RSS Feed
- Permalink
- Report Inappropriate Content

I'm trying to calculate the amount of concurrent calls per minute or another time span (e.g. 5 minutes, ...). I'm using the concurrency function to achieve that. There's one problem though: The function only considers events to calculate the amount of concurrent calls but I would like to sample every minute.
My json records contain a _time and a call_duration. My current query looks as follows
index=myIndex source=test11 | fields + call_duration | fields - _raw | concurrency duration=call_duration | timechart max(concurrency) as "Simultaneous calls" span=1m
The data is as follows:

The resulting chart:
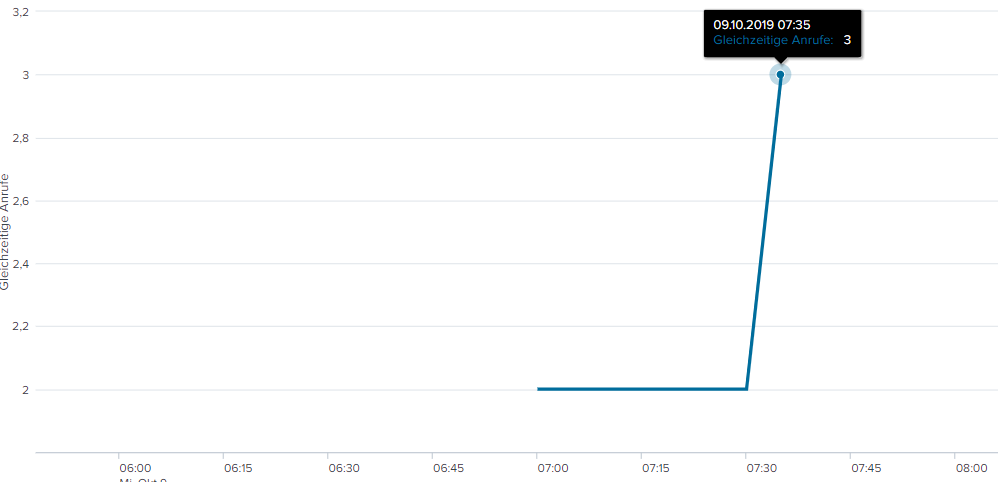
The concurrent calls from 7:10:00 to 7:11:00 would be 1 but are shown as 2, because no event occurs during that time. I can't add fake events because then there would be 1 call at that time. So is there a possibility to sample every minute with the concurrency call?
The same effect happens from 7:20 to 7:30. There is only 1 call at that time but the graph shows 2, because of the surrounding data points.
- Mark as New
- Bookmark Message
- Subscribe to Message
- Mute Message
- Subscribe to RSS Feed
- Permalink
- Report Inappropriate Content
another solution is to directly use the makecontinuous, and tweak the concurrency calculation to correct the added events:
| makecontinuous _time span=1m |fillnull call_duration | concurrency duration=call_duration | eval concurrency=if(call_duration=0,concurrency-1,concurrency) |fields _time concurrency
This works well, but the chart ends a the beginning of the last call. Depending on your use case, this may be a problem or not.
- Mark as New
- Bookmark Message
- Subscribe to Message
- Mute Message
- Subscribe to RSS Feed
- Permalink
- Report Inappropriate Content
another solution is to directly use the makecontinuous, and tweak the concurrency calculation to correct the added events:
| makecontinuous _time span=1m |fillnull call_duration | concurrency duration=call_duration | eval concurrency=if(call_duration=0,concurrency-1,concurrency) |fields _time concurrency
This works well, but the chart ends a the beginning of the last call. Depending on your use case, this may be a problem or not.
- Mark as New
- Bookmark Message
- Subscribe to Message
- Mute Message
- Subscribe to RSS Feed
- Permalink
- Report Inappropriate Content
One solution is to re-implement yourself a concurrency calculation. It involves creating an event when the call starts, and another when the call ends. Give the start a value of +1 and the end -1, and Streamstats will allow you to keep a running count of calls. Finally, with makecontinuous, you can fill the time stamps between "events" to get a visualisation of the actual concurrent calls.
|eval end_time=_time+call_duration| eval time=mvappend(_time,end_time) | mvexpand time | sort 0 time |eval start_stop=if(end_time=time,-1,1)|makecontinuous time span=1m|streamstats sum(start_stop) as concurent | eval _time=time | fields _time concurent





Join the Splunk Community Slack to learn, troubleshoot, and make connections with fellow Splunk practitioners in real time!
Join Splunk User Groups to connect and learn in-person by region or remotely by topic or industry.
Meet Splunk Observability Studio: AI-Assisted OpenTelemetry Instrumentation Without ...
Federated Search for Cisco Security and Analytics Logging (SAL) is now GA on Splunk ...
Your Path to AgenticOps: AI Experiences for Every Splunk Practitioner
