Turn on suggestions
Auto-suggest helps you quickly narrow down your search results by suggesting possible matches as you type.
Splunk Search
×
Join the Conversation
Without signing in, you're just watching from the sidelines. Sign in or Register to connect, share, and be part of the Splunk Community.
- Find Answers
- :
- Using Splunk
- :
- Splunk Search
- :
- Combinig two graphs into one
Options
- Subscribe to RSS Feed
- Mark Topic as New
- Mark Topic as Read
- Float this Topic for Current User
- Bookmark Topic
- Subscribe to Topic
- Mute Topic
- Printer Friendly Page
- Mark as New
- Bookmark Message
- Subscribe to Message
- Mute Message
- Subscribe to RSS Feed
- Permalink
- Report Inappropriate Content
matansocher
Contributor
03-29-2017
01:37 AM
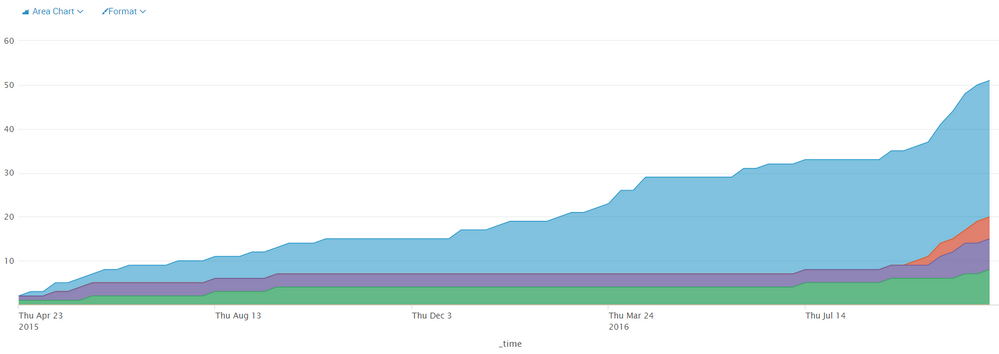
I have two graphs (I put example and their search code) and I want to display them on a single graph.
Is there a way to create that kind of graph?
1
| inputcsv MPSMilstonesCSV
| dedup Report_Milestone
| eval Report_Milestone1 = if((substr(Report_Milestone, 1, 1)  == "S"), substr(Report_Milestone, (len(Report_Milestone)-6), len(Report_Milestone)), Report_Milestone)
| fieldformat TaskDeadline = strftime(TaskDeadline, "%d/%m/%Y")
| streamstats count as milestoneNumber
| eval legend = milestoneNumber+" = "+Report_Milestone1
| table TaskDeadline Report_Milestone1 milestoneNumber legend
| chart sum(milestoneNumber) over TaskDeadline by legend
2
index=clearquest ("Project Name"=ipa_4*)
    ("Task Type"="Enhancement A*" OR "Task Type"=Defe* OR "Task Type"=Doc*)
    "Resolution"=* ("Severity"=*) "Task ID"=*
| dedup "Task ID"
| reverse
| timechart span=1w dc("Task ID") AS sum_of_tasks_per_week by Severity
| accum "S0-Critical"
| accum "S1-High Impact"
| accum "S2-Medium Impact"
| accum "S3-Low Impact"
| accum "S4-Unknown"
| accum "No Value"
Thank you
1 Solution
- Mark as New
- Bookmark Message
- Subscribe to Message
- Mute Message
- Subscribe to RSS Feed
- Permalink
- Report Inappropriate Content
somesoni2
Revered Legend
03-29-2017
11:32 PM
Give this a try. In dashboard panel visualization edit, add the fields from lookup (or from index) as overlay fields.
index=clearquest ("Project Name"=ipa_4*)
     ("Task Type"="Enhancement A*" OR "Task Type"=Defe* OR "Task Type"=Doc*)
     "Resolution"=* ("Severity"=*) "Task ID"=*
 | dedup "Task ID"
 | reverse
 | timechart span=1w dc("Task ID") AS sum_of_tasks_per_week by Severity
 | accum "S0-Critical"
 | accum "S1-High Impact"
 | accum "S2-Medium Impact"
 | accum "S3-Low Impact"
 | accum "S4-Unknown"
 | accum "No Value"
| append [| inputcsv MPSMilstonesCSV
 | dedup Report_Milestone
 | eval Report_Milestone1 = if((substr(Report_Milestone, 1, 1)  == "S"), substr(Report_Milestone, (len(Report_Milestone)-6), len(Report_Milestone)), Report_Milestone)
 | eval _time= TaskDeadline
 | streamstats count as milestoneNumber
 | eval legend = milestoneNumber+" = "+Report_Milestone1
 | chart sum(milestoneNumber) over _timeby legend]
| timechart values(*) as *
- Mark as New
- Bookmark Message
- Subscribe to Message
- Mute Message
- Subscribe to RSS Feed
- Permalink
- Report Inappropriate Content
matansocher
Contributor
04-04-2017
12:11 AM
the answer did not give me the exact result I wanted, but it gave me a direction of how I need to cimbine the 2 queries into 1.
thank you
- Mark as New
- Bookmark Message
- Subscribe to Message
- Mute Message
- Subscribe to RSS Feed
- Permalink
- Report Inappropriate Content
woodcock
Esteemed Legend
03-29-2017
12:23 PM
Your desire is to overlay the graphs semi-transparently as-is to merge the images, right?
- Mark as New
- Bookmark Message
- Subscribe to Message
- Mute Message
- Subscribe to RSS Feed
- Permalink
- Report Inappropriate Content
matansocher
Contributor
03-29-2017
11:17 PM
Yes, exactly.
Got questions? Get answers!
Join the Splunk Community Slack to learn, troubleshoot, and make connections with fellow Splunk practitioners in real time!
Meet up IRL or virtually!
Join Splunk User Groups to connect and learn in-person by region or remotely by topic or industry.
Get Updates on the Splunk Community!
Why Splunk Customers Should Attend Cisco Live 2026 Las Vegas
Why Splunk Customers Should Attend Cisco Live 2026 Las Vegas
Cisco Live 2026 is almost here, and this ...
What Is the Name of the USB Key Inserted by Bob Smith? (BOTS Hint, Not the Answer)
Hello Splunkers,
So you searched, “what is the name of the usb key inserted by bob smith?”
Not gonna lie… ...
Automating Threat Operations and Threat Hunting with Recorded Future
Automating Threat Operations and Threat Hunting
with Recorded Future
June 29, 2026 | Register
Is your ...


