Turn on suggestions
Auto-suggest helps you quickly narrow down your search results by suggesting possible matches as you type.
Showing results for
Splunk Search
Turn on suggestions
Auto-suggest helps you quickly narrow down your search results by suggesting possible matches as you type.
Showing results for
- Splunk Answers
- :
- Using Splunk
- :
- Splunk Search
- :
- Combinig two graphs into one
Options
- Subscribe to RSS Feed
- Mark Topic as New
- Mark Topic as Read
- Float this Topic for Current User
- Bookmark Topic
- Subscribe to Topic
- Mute Topic
- Printer Friendly Page
- Mark as New
- Bookmark Message
- Subscribe to Message
- Mute Message
- Subscribe to RSS Feed
- Permalink
- Report Inappropriate Content
matansocher
Contributor
03-29-2017
01:37 AM
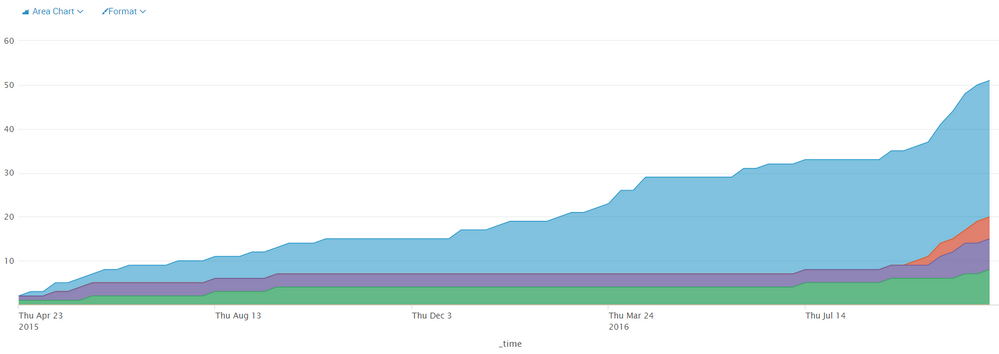
I have two graphs (I put example and their search code) and I want to display them on a single graph.
Is there a way to create that kind of graph?
1
| inputcsv MPSMilstonesCSV
| dedup Report_Milestone
| eval Report_Milestone1 = if((substr(Report_Milestone, 1, 1)  == "S"), substr(Report_Milestone, (len(Report_Milestone)-6), len(Report_Milestone)), Report_Milestone)
| fieldformat TaskDeadline = strftime(TaskDeadline, "%d/%m/%Y")
| streamstats count as milestoneNumber
| eval legend = milestoneNumber+" = "+Report_Milestone1
| table TaskDeadline Report_Milestone1 milestoneNumber legend
| chart sum(milestoneNumber) over TaskDeadline by legend
2
index=clearquest ("Project Name"=ipa_4*)
    ("Task Type"="Enhancement A*" OR "Task Type"=Defe* OR "Task Type"=Doc*)
    "Resolution"=* ("Severity"=*) "Task ID"=*
| dedup "Task ID"
| reverse
| timechart span=1w dc("Task ID") AS sum_of_tasks_per_week by Severity
| accum "S0-Critical"
| accum "S1-High Impact"
| accum "S2-Medium Impact"
| accum "S3-Low Impact"
| accum "S4-Unknown"
| accum "No Value"
Thank you
1 Solution
- Mark as New
- Bookmark Message
- Subscribe to Message
- Mute Message
- Subscribe to RSS Feed
- Permalink
- Report Inappropriate Content
somesoni2
Revered Legend
03-29-2017
11:32 PM
Give this a try. In dashboard panel visualization edit, add the fields from lookup (or from index) as overlay fields.
index=clearquest ("Project Name"=ipa_4*)
     ("Task Type"="Enhancement A*" OR "Task Type"=Defe* OR "Task Type"=Doc*)
     "Resolution"=* ("Severity"=*) "Task ID"=*
 | dedup "Task ID"
 | reverse
 | timechart span=1w dc("Task ID") AS sum_of_tasks_per_week by Severity
 | accum "S0-Critical"
 | accum "S1-High Impact"
 | accum "S2-Medium Impact"
 | accum "S3-Low Impact"
 | accum "S4-Unknown"
 | accum "No Value"
| append [| inputcsv MPSMilstonesCSV
 | dedup Report_Milestone
 | eval Report_Milestone1 = if((substr(Report_Milestone, 1, 1)  == "S"), substr(Report_Milestone, (len(Report_Milestone)-6), len(Report_Milestone)), Report_Milestone)
 | eval _time= TaskDeadline
 | streamstats count as milestoneNumber
 | eval legend = milestoneNumber+" = "+Report_Milestone1
 | chart sum(milestoneNumber) over _timeby legend]
| timechart values(*) as *
- Mark as New
- Bookmark Message
- Subscribe to Message
- Mute Message
- Subscribe to RSS Feed
- Permalink
- Report Inappropriate Content
matansocher
Contributor
04-04-2017
12:11 AM
the answer did not give me the exact result I wanted, but it gave me a direction of how I need to cimbine the 2 queries into 1.
thank you
- Mark as New
- Bookmark Message
- Subscribe to Message
- Mute Message
- Subscribe to RSS Feed
- Permalink
- Report Inappropriate Content
woodcock
Esteemed Legend
03-29-2017
12:23 PM
Your desire is to overlay the graphs semi-transparently as-is to merge the images, right?
- Mark as New
- Bookmark Message
- Subscribe to Message
- Mute Message
- Subscribe to RSS Feed
- Permalink
- Report Inappropriate Content
matansocher
Contributor
03-29-2017
11:17 PM
Yes, exactly.
Get Updates on the Splunk Community!
Announcing Scheduled Export GA for Dashboard Studio
We're excited to announce the general availability of Scheduled Export for Dashboard Studio. Starting in ...
Extending Observability Content to Splunk Cloud
Watch Now!
In this Extending Observability Content to Splunk Cloud Tech Talk, you'll see how to leverage ...
More Control Over Your Monitoring Costs with Archived Metrics GA in US-AWS!
What if there was a way you could keep all the metrics data you need while saving on storage costs?This is now ...


