
Join the Conversation
- Find Answers
- :
- Using Splunk
- :
- Splunk Search
- :
- Re: Column chart based on field value, without eve...
- Subscribe to RSS Feed
- Mark Topic as New
- Mark Topic as Read
- Float this Topic for Current User
- Bookmark Topic
- Subscribe to Topic
- Mute Topic
- Printer Friendly Page
- Mark as New
- Bookmark Message
- Subscribe to Message
- Mute Message
- Subscribe to RSS Feed
- Permalink
- Report Inappropriate Content


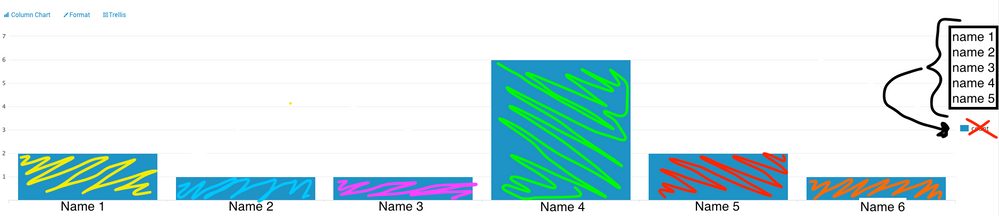
Currently having a hard time figuring out how to create a column chart where the field values show up in the side, so I can color code them in XML.
My query is bringing back the results into a table, which I then pipe into a count command to create this column chart. The chart is exactly the info I want to see, I just can't figure out how to make color code it, since it's all the "count" field in XML.
| Parent search query
| table Name, (other fields)
| stats count by Name
I've looked all over, but just can't figure it out.
- Mark as New
- Bookmark Message
- Subscribe to Message
- Mute Message
- Subscribe to RSS Feed
- Permalink
- Report Inappropriate Content

@jwiley_splunk ,
Try transpose ing it
| Parent search query
| table Name, (other fields)
| stats count by Name
| transpose 0 header_field=Name
What goes around comes around. If it helps, hit it with Karma 🙂
- Mark as New
- Bookmark Message
- Subscribe to Message
- Mute Message
- Subscribe to RSS Feed
- Permalink
- Report Inappropriate Content
@jwiley_splunk ,
Try transpose ing it
| Parent search query
| table Name, (other fields)
| stats count by Name
| transpose 0 header_field=Name
What goes around comes around. If it helps, hit it with Karma 🙂
- Mark as New
- Bookmark Message
- Subscribe to Message
- Mute Message
- Subscribe to RSS Feed
- Permalink
- Report Inappropriate Content
That's almost perfect!
Is there a way to get the original labels back under the columns? 
- Mark as New
- Bookmark Message
- Subscribe to Message
- Mute Message
- Subscribe to RSS Feed
- Permalink
- Report Inappropriate Content
@jwiley_splunk ,
Try this and select "stacked" in the format
 | Parent search query
 | table Name, (other fields)
 | eval _tmp=Name
 | chart count over Name by _tmp
What goes around comes around. If it helps, hit it with Karma 🙂
- Mark as New
- Bookmark Message
- Subscribe to Message
- Mute Message
- Subscribe to RSS Feed
- Permalink
- Report Inappropriate Content
You're a saint. Thank you so much Renjith!



Join the Splunk Community Slack to learn, troubleshoot, and make connections with fellow Splunk practitioners in real time!
Join Splunk User Groups to connect and learn in-person by region or remotely by topic or industry.
ATTENTION: We’re Moving! (AGAIN!)
Deep Dive: Optimizing Telemetry Pipelines in Splunk Observability Cloud
Announcing Modern Navigation: A New Era of Splunk User Experience
