Are you a member of the Splunk Community?
- Find Answers
- :
- Using Splunk
- :
- Splunk Search
- :
- Classic Dashboard query - 3 visuals with 3 differe...
- Subscribe to RSS Feed
- Mark Topic as New
- Mark Topic as Read
- Float this Topic for Current User
- Bookmark Topic
- Subscribe to Topic
- Mute Topic
- Printer Friendly Page
- Mark as New
- Bookmark Message
- Subscribe to Message
- Mute Message
- Subscribe to RSS Feed
- Permalink
- Report Inappropriate Content
Hi all
I have a dashboard that i need to build to show number of Helpdesk calls for :
1) year to date
2) Average monthly
3) Average daily
i have the query set up and I've selected 'year to date'
I've done a | stats count and saved to Dashboard
When i save this onto the dashboard the time has defaulted to last 24 hours. I've gone into the source editor and removed queryparameters but this hasn't helped
i think i need to set the time on my query (at the top) - year to date
Can some help me with this code ?
Many thanks
P
- Mark as New
- Bookmark Message
- Subscribe to Message
- Mute Message
- Subscribe to RSS Feed
- Permalink
- Report Inappropriate Content
Hi @PaulaCom
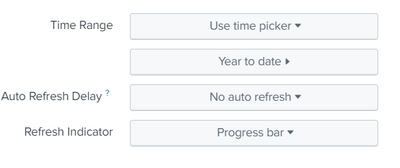
when you edit the dashboard and in the panel if you click the magnifying lens you should get below option where you can set the time range
is it Something you have done it or did i understood your question wrong
- Mark as New
- Bookmark Message
- Subscribe to Message
- Mute Message
- Subscribe to RSS Feed
- Permalink
- Report Inappropriate Content
thank you
i think i was making it more complicated than it needed to be
worked perfectly
P 🙂
- Mark as New
- Bookmark Message
- Subscribe to Message
- Mute Message
- Subscribe to RSS Feed
- Permalink
- Report Inappropriate Content
so I've change the earliest to

