
Turn on suggestions
Auto-suggest helps you quickly narrow down your search results by suggesting possible matches as you type.
Splunk Search
×
Join the Conversation
Without signing in, you're just watching from the sidelines. Sign in or Register to connect, share, and be part of the Splunk Community.
- Find Answers
- :
- Using Splunk
- :
- Splunk Search
- :
- Chart with multiple Row Fields that Share Values O...
Options
- Subscribe to RSS Feed
- Mark Topic as New
- Mark Topic as Read
- Float this Topic for Current User
- Bookmark Topic
- Subscribe to Topic
- Mute Topic
- Printer Friendly Page
- Mark as New
- Bookmark Message
- Subscribe to Message
- Mute Message
- Subscribe to RSS Feed
- Permalink
- Report Inappropriate Content

jjezusek
Engager
03-21-2019
09:27 AM
Hello,
I was wondering if you can have a chart that compares the average of one field depending on the value of several other fields. I want to compare the average runtime of a query and compare the time depending on how many certain conditions are set. So for example I want to see the difference of having 1 integer condition compared to 1 varchar condition as a side by side bar chart. The two charts I have that show the results are below:
| chart avg(runtime) as "Average Run Time(ms)" by Total.Count.Integer.Conditons

| chart avg(runtime) as "Average Run Time(ms)" by Total.Count.Varchar.Conditons
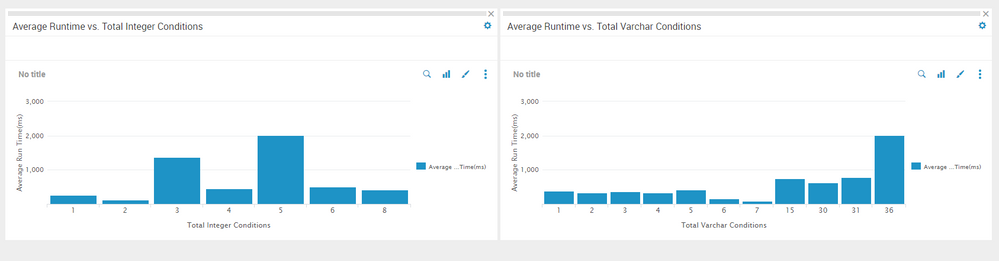
So the above two charts would ideally be one grouped by the number of conditions.
Thanks!
1 Solution
- Mark as New
- Bookmark Message
- Subscribe to Message
- Mute Message
- Subscribe to RSS Feed
- Permalink
- Report Inappropriate Content

somesoni2
Revered Legend
03-21-2019
01:28 PM
Give this a try
your current search before the chart command which has fields runtime  Total.Count.Integer.Conditons Total.Count.Varchar.Conditons
| untable runtime condition TotalCount
| eval IntRuntime=if(condition="Total.Count.Integer.Conditons",runtime, null())
| eval VarRuntime=if(condition="Total.Count.Varchar.Conditons",runtime, null())
| stats avg(IntRuntime) as "Average Run Time(ms) - Integer Condition"  avg(VarRuntime) as "Average Run Time(ms) - Varchar Condition" by TotalCount
- Mark as New
- Bookmark Message
- Subscribe to Message
- Mute Message
- Subscribe to RSS Feed
- Permalink
- Report Inappropriate Content
somesoni2
Revered Legend
03-21-2019
01:28 PM
Give this a try
your current search before the chart command which has fields runtime  Total.Count.Integer.Conditons Total.Count.Varchar.Conditons
| untable runtime condition TotalCount
| eval IntRuntime=if(condition="Total.Count.Integer.Conditons",runtime, null())
| eval VarRuntime=if(condition="Total.Count.Varchar.Conditons",runtime, null())
| stats avg(IntRuntime) as "Average Run Time(ms) - Integer Condition"  avg(VarRuntime) as "Average Run Time(ms) - Varchar Condition" by TotalCount
- Mark as New
- Bookmark Message
- Subscribe to Message
- Mute Message
- Subscribe to RSS Feed
- Permalink
- Report Inappropriate Content
jjezusek
Engager
03-22-2019
07:43 AM
Thank you. This was able to work!



Got questions? Get answers!
Join the Splunk Community Slack to learn, troubleshoot, and make connections with fellow Splunk practitioners in real time!
Meet up IRL or virtually!
Join Splunk User Groups to connect and learn in-person by region or remotely by topic or industry.
Get Updates on the Splunk Community!
Supercharging Windows Security Detection Performance: Introducing Hybrid Field ...
Windows event logs—from Security auditing and Sysmon to PowerShell script blocks—form the operational backbone ...
Enriching Signals with the OTel Lookup Processor
Introduction
Raw telemetry is often incomplete. A log line might record an IP address, but what you really ...
Meet the .conf26 AI Agent Buildathon Winners
At the .conf26 AI Agent Buildathon, Splunk users turned their operational expertise into working AI agents ...
