
Join the Conversation
- Find Answers
- :
- Using Splunk
- :
- Splunk Search
- :
- Re: Chart increment problem (decimal not integer)
- Subscribe to RSS Feed
- Mark Topic as New
- Mark Topic as Read
- Float this Topic for Current User
- Bookmark Topic
- Subscribe to Topic
- Mute Topic
- Printer Friendly Page
- Mark as New
- Bookmark Message
- Subscribe to Message
- Mute Message
- Subscribe to RSS Feed
- Permalink
- Report Inappropriate Content

Hello guys,
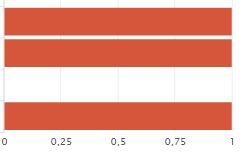
I've a problem : I can't set integers for the X axis, I have sometimes decimal values :
XML options:
    <option name="charting.axisLabelsX.majorLabelStyle.overflowMode">ellipsisNone</option>
    <option name="charting.axisLabelsX.majorLabelStyle.rotation">0</option>
    <option name="charting.axisTitleX.visibility">visible</option>
    <option name="charting.axisTitleY.visibility">visible</option>
    <option name="charting.axisTitleY2.visibility">visible</option>
    <option name="charting.axisX.scale">linear</option>
    <option name="charting.axisY.scale">linear</option>
    <option name="charting.axisY2.enabled">0</option>
    <option name="charting.axisY2.scale">inherit</option>
    <option name="charting.chart">bar</option>
    <option name="charting.chart.bubbleMaximumSize">50</option>
    <option name="charting.chart.bubbleMinimumSize">10</option>
    <option name="charting.chart.bubbleSizeBy">area</option>
    <option name="charting.chart.nullValueMode">gaps</option>
    <option name="charting.chart.showDataLabels">none</option>
    <option name="charting.chart.sliceCollapsingThreshold">0.01</option>
    <option name="charting.chart.stackMode">default</option>
    <option name="charting.chart.style">shiny</option>
    <option name="charting.drilldown">none</option>
    <option name="charting.layout.splitSeries">0</option>
    <option name="charting.legend.labelStyle.overflowMode">ellipsisMiddle</option>
    <option name="charting.legend.placement">right</option>
    <option name="link.visible">0</option>

    <option name="charting.axisLabelsX.integerUnits">true</option>
    <option name="charting.axisLabelsX.majorUnit">1</option>
    <option name="charting.axisX.minimumNumber">1</option>
Thanks.
- Mark as New
- Bookmark Message
- Subscribe to Message
- Mute Message
- Subscribe to RSS Feed
- Permalink
- Report Inappropriate Content

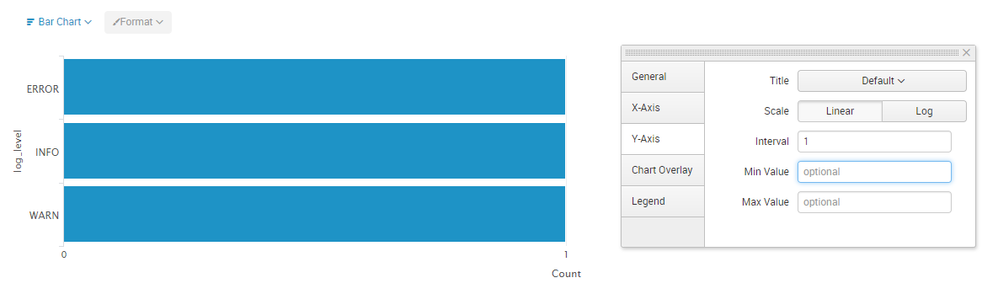
@realsplunk... You are using Bar chart so X-axis is actually Y-axis in the chart. The reason why you are seeing decimals is because Splunk chart automatically adjusts Major Units of an axis based on Minimum and Maximum Data Points. Based on the screenshot your Min and Max points are 0 and 1 hence the intervals are in decimal. You can set the majorUnit to 1 to stop this. However, you should do this only if your maximum value is low (preferably in 1-10 or so). You can either add the following in Simple XML or set the Interval from Chart Settings in UI (as shown in attached image).
<option name="charting.axisLabelsY.majorUnit">1</option>
| makeresults | eval message= "Happy Splunking!!!"
- Mark as New
- Bookmark Message
- Subscribe to Message
- Mute Message
- Subscribe to RSS Feed
- Permalink
- Report Inappropriate Content
@realsplunk... You are using Bar chart so X-axis is actually Y-axis in the chart. The reason why you are seeing decimals is because Splunk chart automatically adjusts Major Units of an axis based on Minimum and Maximum Data Points. Based on the screenshot your Min and Max points are 0 and 1 hence the intervals are in decimal. You can set the majorUnit to 1 to stop this. However, you should do this only if your maximum value is low (preferably in 1-10 or so). You can either add the following in Simple XML or set the Interval from Chart Settings in UI (as shown in attached image).
<option name="charting.axisLabelsY.majorUnit">1</option>
| makeresults | eval message= "Happy Splunking!!!"
- Mark as New
- Bookmark Message
- Subscribe to Message
- Mute Message
- Subscribe to RSS Feed
- Permalink
- Report Inappropriate Content
Thanks a lot!!! That was ambiguous and misleading.
- Mark as New
- Bookmark Message
- Subscribe to Message
- Mute Message
- Subscribe to RSS Feed
- Permalink
- Report Inappropriate Content

It depends on your search; what is your search string and what is your timepicker setting for it?
- Mark as New
- Bookmark Message
- Subscribe to Message
- Mute Message
- Subscribe to RSS Feed
- Permalink
- Report Inappropriate Content
Something like :
index=... | stats dc(file) by user
timepicker : today
Thanks a lot.




Join the Splunk Community Slack to learn, troubleshoot, and make connections with fellow Splunk practitioners in real time!
Join Splunk User Groups to connect and learn in-person by region or remotely by topic or industry.
Data Management Digest – September 2026
Federated Search for CloudWatch Unified Data Store Is Generally Available
Announcing Modern Navigation: A New Era of Splunk User Experience
