- Mark as New
- Bookmark Message
- Subscribe to Message
- Mute Message
- Subscribe to RSS Feed
- Permalink
- Report Inappropriate Content
Hello,
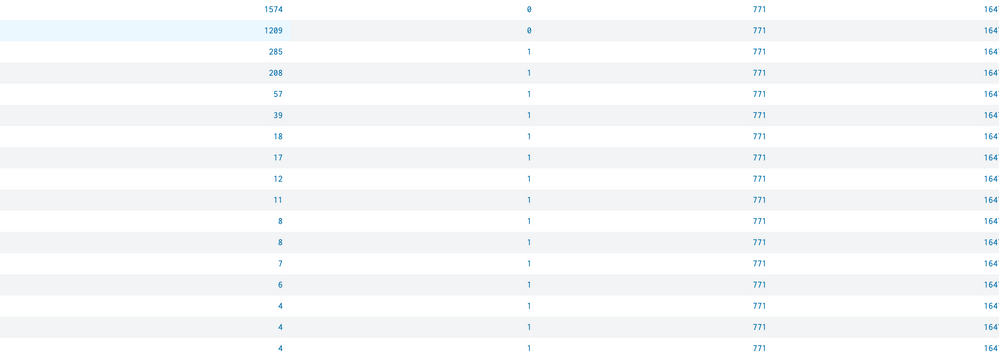
I am trying to find outliers on a graph by using the median absolute deviation on a graph. I know that the machine learning toolkit for splunk can do this but I'm not using that right now. Essentially, we have the count of ip addresses over time because we are tracking how many times this ip address generates an event. So we have this count value plotted over time. I need to calculate the median absolute deviation and for some reason it doesn't seem to be able to get the median of this. It seems to grab one of the bigger count values as the median even if this value only shows once. There are clearly other values which should be selected as the median yet they were not. (The first column in the table is the count values. There is more than shown but it is clear that 1209 is an outlier, and should not be the median)
index=data sourcetype=json seen.indicator=X.X.X.X
| bin _time span=30m
| eventstats count(seen.indicator) as "Count" by _time
| eventstats values(Count) as valu
| eventstats count(valu) as help by _time
| eventstats median(Count) as med
| eval newValue = abs(Count-med)
| eventstats median(newValue) as medianAbsDev by seen.indicator
| eval upper = med+(medianAbsDev*1.2)
| eval lower = med-(medianAbsDev*1.2)
| eval isOutlier=if(Count < lower OR Count > upper, 1, 0)
| timechart span=30m count(seen.indicator) as CountOfIndicator, eval(values(upper)) as upperl, eval(values(lower)) as lowerl, eval(values(isOutlier)) as Outliers by seen.indicator usenull=f useother=f
| filldown
- Mark as New
- Bookmark Message
- Subscribe to Message
- Mute Message
- Subscribe to RSS Feed
- Permalink
- Report Inappropriate Content
Here is my answer that ended up working
index=data sourcetype=json

| bin _time span=$bspan$

| stats count(seen.indicator) as Con by _time seen.indicator

| eventstats median(Con) as "med" by seen.indicator

| eval newV = abs(Con-med)

| eventstats median(newV) as medianAbsDev by seen.indicator

| eval upper = med+(medianAbsDev*$sensitivity$)

| eval lower = med-(medianAbsDev*$sensitivity$)

| eval isOutlier=if(Con < lower OR Con > upper, 1, 0)

| timechart span=$bspan$ values(Con) as CountOfIndicator, eval(values(upper)) as upperl, eval(values(lower)) as lowerl, eval(values(isOutlier)) as Outliers by seen.indicator usenull=f useother=f

| filldown
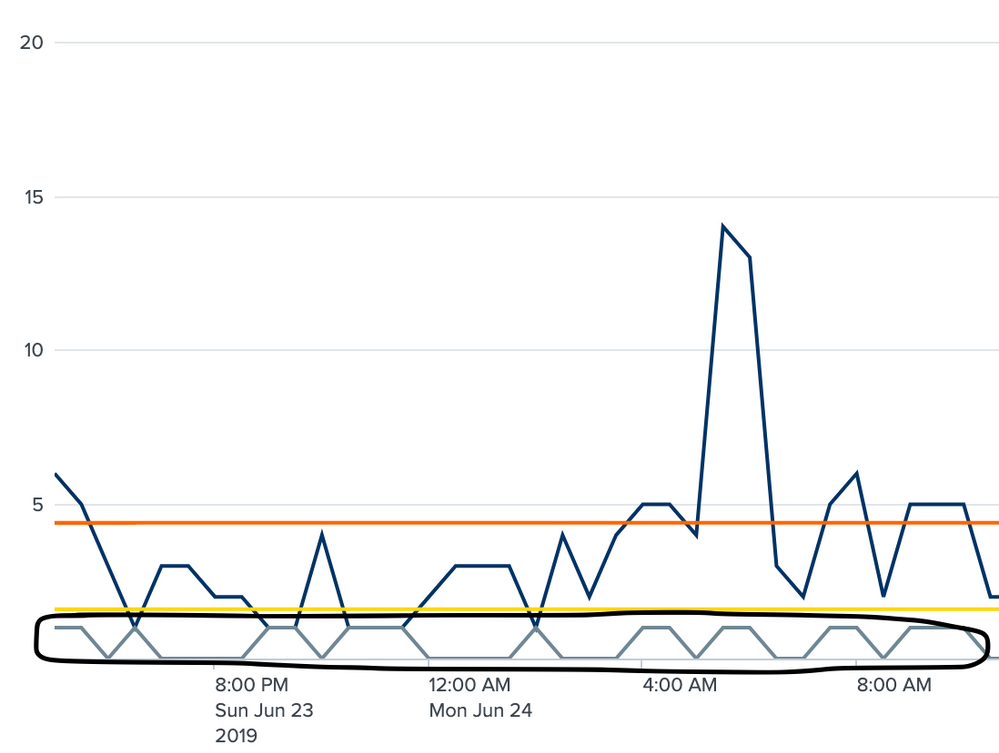
If anyone can answer, how can I make the outliers more visible and outlined? The line that shows the outliers is pointed to by the black box I drew around it. It is 1 where there is an outlier in the count above. Can I somehow outline or highlight the points above?
- Mark as New
- Bookmark Message
- Subscribe to Message
- Mute Message
- Subscribe to RSS Feed
- Permalink
- Report Inappropriate Content
[UPDATED ANSWER] based on further details provided
@cxr5971 the window argument of streamstats command creates the sliding window for calculating outlier. So if your data is periodic for example each saturday 02:00 to 04:00 am is the time for backup job then data during the same time will be similar week over week and should not be considered outlier. Several similar situations like if weekdays working hours vs off hours will have similar trends then you would want to apply a period of 1 week as window, which can be done via streamstats command.
Since your minimum time span is 30 minute, i.e. 2 time window in 1 hour, I created a window of 2*24*7=336 (corrected below as well as I had added *4 for 4 weeks time which should not be considered as window) for 1 week.
Do also go through the Splunk Blog Cyclical Statistical Forecast and Anomalies Part 1, 2 and 3 to try a sample walk-through.
If you want to represent the outliers better you can try one of my older answers: https://answers.splunk.com/answers/747177/how-to-add-a-reference-line-to-an-outlier-chart-cr.html
@cxr5971 even if you can not deploy MLTK on your production system, you should go ahead and deploy the same on your local because MLTK allows you to see the SPL and implement the same in your own dashboard with your data. Standard Deviation queries are based on Splunk Core implementations hence can be directly adopted.
Following the SPL for Mean Absolute Deviation (window of 2*24*7=336 where 30 min=1/2 hour hence 24*2=48 points in a day, and multiplier of 1.25 as per your query, which you can adjust as per your window and time span)
<yourData>
| timechart span=30m max(seen.indicator) as responsetime
| streamstats window=336 current=true median("responsetime") as median
| eval absDev=(abs('responsetime'-median))
| streamstats window=336 current=true median(absDev) as medianAbsDev
| eval lowerBound=(median-medianAbsDev*exact(1.25)), upperBound=(median+medianAbsDev*exact(1.25))
| eval isOutlier=if('responsetime' < lowerBound OR 'responsetime' > upperBound, 1, 0)
| fields _time, "responsetime", lowerBound, upperBound, isOutlier, *
| makeresults | eval message= "Happy Splunking!!!"
- Mark as New
- Bookmark Message
- Subscribe to Message
- Mute Message
- Subscribe to RSS Feed
- Permalink
- Report Inappropriate Content
@niketnilay
Thank you for your response. I have solved my issue without streamstats as noted to my own answer below but what is the reasoning for using streamstats? I see this usage in quite a few outlier detection SPL queries but it doesn't provide results that are useful for me.
Could you explain its usage beyond the splunk documentation and how it may or may not be useful here?
Also is there a simple way to use my outlier eval to highlight the outliers like the machine learning visualization does?
- Mark as New
- Bookmark Message
- Subscribe to Message
- Mute Message
- Subscribe to RSS Feed
- Permalink
- Report Inappropriate Content
@cxr5971 I have updated my answer as per your further questions. Do accept/up-vote the answer if it helped.
| makeresults | eval message= "Happy Splunking!!!"
- Mark as New
- Bookmark Message
- Subscribe to Message
- Mute Message
- Subscribe to RSS Feed
- Permalink
- Report Inappropriate Content
your query looks correct, why do you say 1209 is the median? Can you check this?
index=data sourcetype=json seen.indicator=X.X.X.X
 | bin _time span=30m
 | eventstats count(seen.indicator) as "Count" by _time
 | eventstats values(Count) as valu
 | eventstats count(valu) as help by _time
 | eventstats median(Count) as med
 | eval newValue = abs(Count-med)
 | eventstats median(newValue) as medianAbsDev by seen.indicator| table Count,med,medianAbsDev,newValue
check med n medianAbsDev...how do they look?
- Mark as New
- Bookmark Message
- Subscribe to Message
- Mute Message
- Subscribe to RSS Feed
- Permalink
- Report Inappropriate Content
See my contributions below. It seemed as though it wasn't working with the count properly. It seemed as though it was using the count number as the number of times as well. So 1209, was essentially "appearing" 1209 times. Which obviously is not the case, and threw off my median.


