- Find Answers
- :
- Using Splunk
- :
- Splunk Search
- :
- Re: Bar Chart Line, based stats sum
- Subscribe to RSS Feed
- Mark Topic as New
- Mark Topic as Read
- Float this Topic for Current User
- Bookmark Topic
- Subscribe to Topic
- Mute Topic
- Printer Friendly Page
- Mark as New
- Bookmark Message
- Subscribe to Message
- Mute Message
- Subscribe to RSS Feed
- Permalink
- Report Inappropriate Content
Regard's,
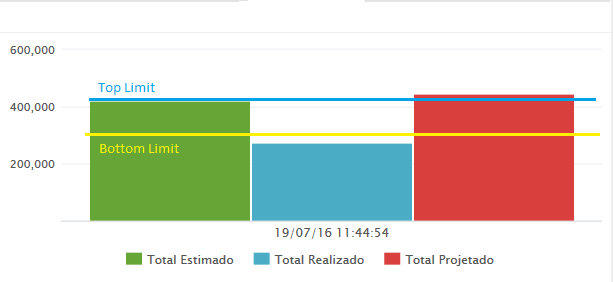
I have a bar chart is a project cost of summation. In this chart I need to have two vertical lines where :
Topline is the upper limit and the lower the minimum limit cost of a project. The bottom line is 80 % of the estimated total project cost and the top line represents 120% of that cost
You can enter these two lines in a bar graph without series , as in the image below :
- Mark as New
- Bookmark Message
- Subscribe to Message
- Mute Message
- Subscribe to RSS Feed
- Permalink
- Report Inappropriate Content
Try this workaround (the width of column will get reduced), if output like this is acceptable for you.
sourcetype="relatorioGeral" considerar=Sim esforco="" status_projeto="Execução" codigo != NULL categoria="Projeto" cliente="" gp="" | dedup codigo | eval min=custo_total_estimado  0.8 | eval max=custo_total_estimado * 1.2 | stats last(_time) as Periodo, sum(custo_total_estimado) as "Total Estimado", sum(custo_total_realizado) as "Total Realizado", sum(custo_total_projetado) as "Total Projetado", sum(max) as "Limite Máximo", sum(min) as "Limite Mínimo"
| appendpipe [| eval Periodo=Periodo-1 | eval "Total Estimado"=null() | eval  "Total Realizado"=null() | eval "Total Projetado"=null() ]
| appendpipe [| eval Periodo=Periodo+1 | eval "Total Estimado"=null() | eval  "Total Realizado"=null() | eval "Total Projetado"=null() ]
| sort Periodo
- Mark as New
- Bookmark Message
- Subscribe to Message
- Mute Message
- Subscribe to RSS Feed
- Permalink
- Report Inappropriate Content
Take a look at this excellent Q&A:
https://answers.splunk.com/answers/426394/is-conditional-background-coloring-possible-in-spl.html
- Mark as New
- Bookmark Message
- Subscribe to Message
- Mute Message
- Subscribe to RSS Feed
- Permalink
- Report Inappropriate Content
Try this workaround (the width of column will get reduced), if output like this is acceptable for you.
sourcetype="relatorioGeral" considerar=Sim esforco="" status_projeto="Execução" codigo != NULL categoria="Projeto" cliente="" gp="" | dedup codigo | eval min=custo_total_estimado  0.8 | eval max=custo_total_estimado * 1.2 | stats last(_time) as Periodo, sum(custo_total_estimado) as "Total Estimado", sum(custo_total_realizado) as "Total Realizado", sum(custo_total_projetado) as "Total Projetado", sum(max) as "Limite Máximo", sum(min) as "Limite Mínimo"
| appendpipe [| eval Periodo=Periodo-1 | eval "Total Estimado"=null() | eval  "Total Realizado"=null() | eval "Total Projetado"=null() ]
| appendpipe [| eval Periodo=Periodo+1 | eval "Total Estimado"=null() | eval  "Total Realizado"=null() | eval "Total Projetado"=null() ]
| sort Periodo
- Mark as New
- Bookmark Message
- Subscribe to Message
- Mute Message
- Subscribe to RSS Feed
- Permalink
- Report Inappropriate Content
Thanks somesoni2,
I made some changes and got what I needed .
- Mark as New
- Bookmark Message
- Subscribe to Message
- Mute Message
- Subscribe to RSS Feed
- Permalink
- Report Inappropriate Content
Could use a bit more information to fully understand what you are trying to do specifically, but you can put simple lines across a chart like that with an eval command.
<search terms> | eval top=400000 | eval bottom=300000 | timechart sum(value) as "Total Value" ... max(top) as "Top Line" max(bottom) as "Bottom Line"
In your graph choose column format, then you can choose format and click on Chart overlay and add Top & Bottom limits as overlays. There are also options you could add to a dashboard to do this...
<option name="charting.chart">column</option>
<option name="charting.chart.overlayFields">"Top Line","Bottom Line"</option>
- Mark as New
- Bookmark Message
- Subscribe to Message
- Mute Message
- Subscribe to RSS Feed
- Permalink
- Report Inappropriate Content
Hi Jeremiahc4,
What I am tendando do is the following :
sourcetype="relatorioGeral"  considerar=Sim esforco="" status_projeto="Execução" codigo != NULL


categoria='Projeto' cliente='' gp='*'


| dedup codigo

| eval min=custo_total_estimado * 0.8


| eval max=custo_total_estimado * 1.2

| stats last(_time) as Periodo,


sum(custo_total_estimado) as 'Total Estimado',


sum(custo_total_realizado) as 'Total Realizado',

sum(custo_total_projetado) as 'Total Projetado',

sum(max) as 'Limite Máximo',

sum(min) as 'Limite Mínimo'
And choose the columns:

And the result:

Has somehow show these points as lines ?
- Mark as New
- Bookmark Message
- Subscribe to Message
- Mute Message
- Subscribe to RSS Feed
- Permalink
- Report Inappropriate Content
Assuming you have a query like this ... | timechart sum(cost) as summation by something. To this, add the following. and set TopLimit & BottomLimit as overlay values
.... | eval TopLimit=Estimate*1.2 | eval BottomLimit=Estimate*.8
http://docs.splunk.com/Documentation/Splunk/6.3.0/Viz/Editdashboardpanelvisualizations#Chart_Overlay
- Mark as New
- Bookmark Message
- Subscribe to Message
- Mute Message
- Subscribe to RSS Feed
- Permalink
- Report Inappropriate Content
Thank you for sundareshr response .
I have detailed what I'm trying to do below

