- Find Answers
- :
- Using Splunk
- :
- Splunk Search
- :
- Aggregate results with count
- Subscribe to RSS Feed
- Mark Topic as New
- Mark Topic as Read
- Float this Topic for Current User
- Bookmark Topic
- Subscribe to Topic
- Mute Topic
- Printer Friendly Page
- Mark as New
- Bookmark Message
- Subscribe to Message
- Mute Message
- Subscribe to RSS Feed
- Permalink
- Report Inappropriate Content
Hi there,
Got some pain with aggregating results from 2 queries, which seemed simple at first glance...
Query 1:
sourcetype="xxxx" severity=medium OR severity=high OR severity=critical | timechart span=1d count by severity
Query 2:
sourcetype="yyyy" request_status=blocked violation_rating>=3 | eval severity=case(violation_rating=3,"medium",violation_rating=4,"high",violation_rating=5,"critical") | timechart span=1d count by severity
The 2 queries are producing same columns ( _time, critical, high, medium), but I find it fairly difficult to simply aggregate the results...
If you have any hints...
This is producing NULL values and the values in the output are not correct:
(sourcetype="yyyy" request_status=blocked violation_rating>=3) OR (sourcetype="xxxx" severity=medium OR severity=high OR severity=critical) | eval severity=case(violation_rating=3,"medium",violation_rating=4,"high",violation_rating=5,"critical") | timechart span=1d count by severity
- Mark as New
- Bookmark Message
- Subscribe to Message
- Mute Message
- Subscribe to RSS Feed
- Permalink
- Report Inappropriate Content
Here is the solution I found, thanks a lot for help
(sourcetype="xxx" request_status=blocked violation_rating>=3) OR (sourcetype="yyy" severity=medium OR severity=high OR severity=critical)
| eval mySeverity = if(isnull(violation_rating), severity, case(violation_rating=3,"medium",violation_rating=4,"high",violation_rating=5,"critical"))
| timechart span=1d count by mySeverity
This seems to be working now
- Mark as New
- Bookmark Message
- Subscribe to Message
- Mute Message
- Subscribe to RSS Feed
- Permalink
- Report Inappropriate Content
Possibly the eval is overwriting values of severity already set with null values. Try using coalesce to only evaluate based on violation_rating if severity isn't already set
(sourcetype="yyyy" request_status=blocked violation_rating>=3) OR (sourcetype="xxxx" severity=medium OR severity=high OR severity=critical)
| eval severity=coalesce(severity,case(violation_rating=3,"medium",violation_rating=4,"high",violation_rating=5,"critical"))
| timechart span=1d count by severity- Mark as New
- Bookmark Message
- Subscribe to Message
- Mute Message
- Subscribe to RSS Feed
- Permalink
- Report Inappropriate Content
hi @sweiland ,
Command eval serverity= creates a new severity field with Values in Query 2 only and values from Query 1 will be vanished. Create a new field with a different name and use coalesce function to merge values of two fields like below.
(sourcetype="yyyy" request_status=blocked violation_rating>=3) OR (sourcetype="xxxx" severity=medium OR severity=high OR severity=critical) | eval severity_2=case(violation_rating=3,"medium",violation_rating=4,"high",violation_rating=5,"critical"), severity= coalesce(severity, severity_2) | timechart span=1d count by severity
If this reply helps you, an upvote/like would be appreciated.
- Mark as New
- Bookmark Message
- Subscribe to Message
- Mute Message
- Subscribe to RSS Feed
- Permalink
- Report Inappropriate Content
Thanks for hints, I guess it is also not that easy to troubleshoot remotely, but here are the results of this query:
It seems to include other levels (informational, Warning, Error, ...), and does not aggregate some fields (got 2 critical columns, but 5+17=22, should be 2+17=19)
Maybe a join on _time field would have helped aggregating results from the 2 queries ?
- Mark as New
- Bookmark Message
- Subscribe to Message
- Mute Message
- Subscribe to RSS Feed
- Permalink
- Report Inappropriate Content
The search is case insensitive and Critical is not the same as critical when it comes to doing the stats. Try:
(sourcetype="yyyy" request_status=blocked violation_rating>=3) OR sourcetype="xxxx"
| eval severity=coalesce(severity,case(violation_rating=3,"Medium",violation_rating=4,"High",violation_rating=5,"Critical"))
| where (severity="Medium" OR severity="High" OR severity="Critical")
| timechart span=1d count by severity- Mark as New
- Bookmark Message
- Subscribe to Message
- Mute Message
- Subscribe to RSS Feed
- Permalink
- Report Inappropriate Content
Very weird because query1 & query2 do NOT have any "Critical" intead of "critical" (I added to check if there is any value), but I found out that query2 has also a severity field that I do not need/use.
I tried your query but does not give the waited output, so I tried to lowercase everything, but result is that I have only query1 now as output...
I am wondering if maybe I can use "if(isnull(severity), eval xxxx, severity)" to fill the NULL values or something like that
One query gives me 715 events, and the other 3985 events, so I need to have around 4700 events after aggregation
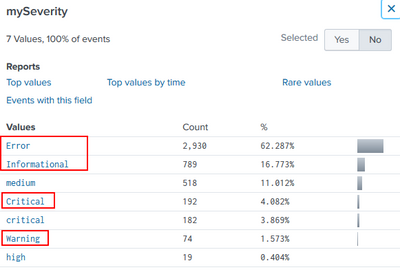
I am trying to use another field called "mySeverity" to get the filter I need:
(sourcetype="xxx" request_status=blocked violation_rating>=3) OR (sourcetype="yyy" severity=medium OR severity=high OR severity=critical)
| eval mySeverity = if(isnull(severity), coalesce(severity,case(violation_rating=3,"medium",violation_rating=4,"high",violation_rating=5,"critical")), severity)
This still does not work because the severity field is not null as I expected but with propercase value I need to get rid:


