
Join the Conversation
- Find Answers
- :
- Using Splunk
- :
- Splunk Search
- :
- Re: Add two lines in a chart
- Subscribe to RSS Feed
- Mark Topic as New
- Mark Topic as Read
- Float this Topic for Current User
- Bookmark Topic
- Subscribe to Topic
- Mute Topic
- Printer Friendly Page
- Mark as New
- Bookmark Message
- Subscribe to Message
- Mute Message
- Subscribe to RSS Feed
- Permalink
- Report Inappropriate Content

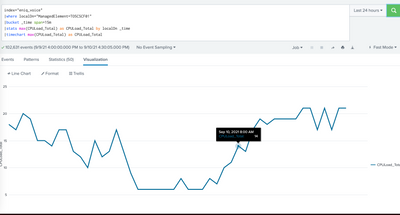
I have this query and I want to add another data series/line to this chart. How can I do it?
index="eniq_voice"
|where localDn="ManagedElement=TO5CSCF01"
|bucket _time span=15m
|stats max(CPULoad_Total) as CPULoad_Total by localDn _time
|timechart max(CPULoad_Total) as CPULoad_Total
I want to add this to the query with a linechart:
|stats max(CPULoad_Max) as CPULoad_Max by localDn _time
|timechart max(CPULoad_Max) as CPULoad_Max by localDn _time
- Mark as New
- Bookmark Message
- Subscribe to Message
- Mute Message
- Subscribe to RSS Feed
- Permalink
- Report Inappropriate Content

Hi
index="eniq_voice"
|where localDn="ManagedElement=TO5CSCF01"
|bucket _time span=15m
|stats max(CPULoad_Total) as CPULoad_Total by localDn _time
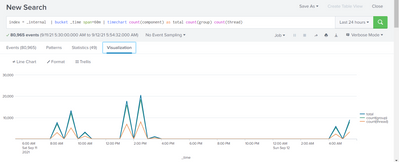
|timechart max(CPULoad_Total) as CPULoad_Total max(CPULoad_Max) as CPULoad_Max
This should help . Basically you can add as much as line you want see example below
- Mark as New
- Bookmark Message
- Subscribe to Message
- Mute Message
- Subscribe to RSS Feed
- Permalink
- Report Inappropriate Content
Hi
index="eniq_voice"
|where localDn="ManagedElement=TO5CSCF01"
|bucket _time span=15m
|stats max(CPULoad_Total) as CPULoad_Total by localDn _time
|timechart max(CPULoad_Total) as CPULoad_Total max(CPULoad_Max) as CPULoad_Max
This should help . Basically you can add as much as line you want see example below
- Mark as New
- Bookmark Message
- Subscribe to Message
- Mute Message
- Subscribe to RSS Feed
- Permalink
- Report Inappropriate Content


Does this give you what you want?
index="eniq_voice"
|where localDn="ManagedElement=TO5CSCF01"
|bucket _time span=15m
|stats max(CPULoad_Total) as CPULoad_Total max(CPULoad_Max) as CPULoad_Max by localDn _time
|timechart max(CPULoad_Total) as CPULoad_Total max(CPULoad_Max) as CPULoad_Max- Mark as New
- Bookmark Message
- Subscribe to Message
- Mute Message
- Subscribe to RSS Feed
- Permalink
- Report Inappropriate Content
Sorry, it doesnt. I dont get any results.


Join the Splunk Community Slack to learn, troubleshoot, and make connections with fellow Splunk practitioners in real time!
Join Splunk User Groups to connect and learn in-person by region or remotely by topic or industry.
A Four-Part Event Series: Full Stack Observability For the AI Era
SOC4Kafka - New Kafka Connector Powered by OpenTelemetry
Event Series: Level up your SOC: Advancing with Splunk Enterprise Security
