Join the Conversation
- Find Answers
- :
- Using Splunk
- :
- Splunk Search
- :
- Re: Add two lines in a chart
- Subscribe to RSS Feed
- Mark Topic as New
- Mark Topic as Read
- Float this Topic for Current User
- Bookmark Topic
- Subscribe to Topic
- Mute Topic
- Printer Friendly Page
- Mark as New
- Bookmark Message
- Subscribe to Message
- Mute Message
- Subscribe to RSS Feed
- Permalink
- Report Inappropriate Content
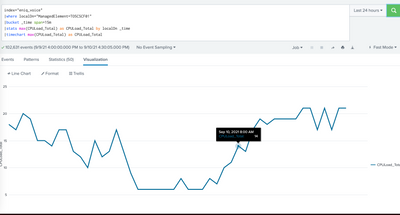
I have this query and I want to add another data series/line to this chart. How can I do it?
index="eniq_voice"
|where localDn="ManagedElement=TO5CSCF01"
|bucket _time span=15m
|stats max(CPULoad_Total) as CPULoad_Total by localDn _time
|timechart max(CPULoad_Total) as CPULoad_Total
I want to add this to the query with a linechart:
|stats max(CPULoad_Max) as CPULoad_Max by localDn _time
|timechart max(CPULoad_Max) as CPULoad_Max by localDn _time
- Mark as New
- Bookmark Message
- Subscribe to Message
- Mute Message
- Subscribe to RSS Feed
- Permalink
- Report Inappropriate Content
Hi
index="eniq_voice"
|where localDn="ManagedElement=TO5CSCF01"
|bucket _time span=15m
|stats max(CPULoad_Total) as CPULoad_Total by localDn _time
|timechart max(CPULoad_Total) as CPULoad_Total max(CPULoad_Max) as CPULoad_Max
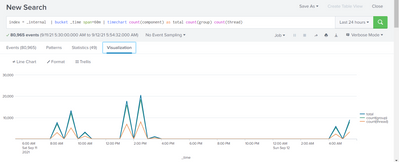
This should help . Basically you can add as much as line you want see example below
- Mark as New
- Bookmark Message
- Subscribe to Message
- Mute Message
- Subscribe to RSS Feed
- Permalink
- Report Inappropriate Content
Does this give you what you want?
index="eniq_voice"
|where localDn="ManagedElement=TO5CSCF01"
|bucket _time span=15m
|stats max(CPULoad_Total) as CPULoad_Total max(CPULoad_Max) as CPULoad_Max by localDn _time
|timechart max(CPULoad_Total) as CPULoad_Total max(CPULoad_Max) as CPULoad_Max- Mark as New
- Bookmark Message
- Subscribe to Message
- Mute Message
- Subscribe to RSS Feed
- Permalink
- Report Inappropriate Content
Sorry, it doesnt. I dont get any results.


