Are you a member of the Splunk Community?
- Find Answers
- :
- Splunk Platform
- :
- Splunk Enterprise
- :
- Re: stats median does not work with 0 value
- Subscribe to RSS Feed
- Mark Topic as New
- Mark Topic as Read
- Float this Topic for Current User
- Bookmark Topic
- Subscribe to Topic
- Mute Topic
- Printer Friendly Page
- Mark as New
- Bookmark Message
- Subscribe to Message
- Mute Message
- Subscribe to RSS Feed
- Permalink
- Report Inappropriate Content
I need to personalize the "Data Processing Queues" monitored made by Monitoring Console.
I found that "median" aggregate function, on stats or timechart commands does not work correctly.
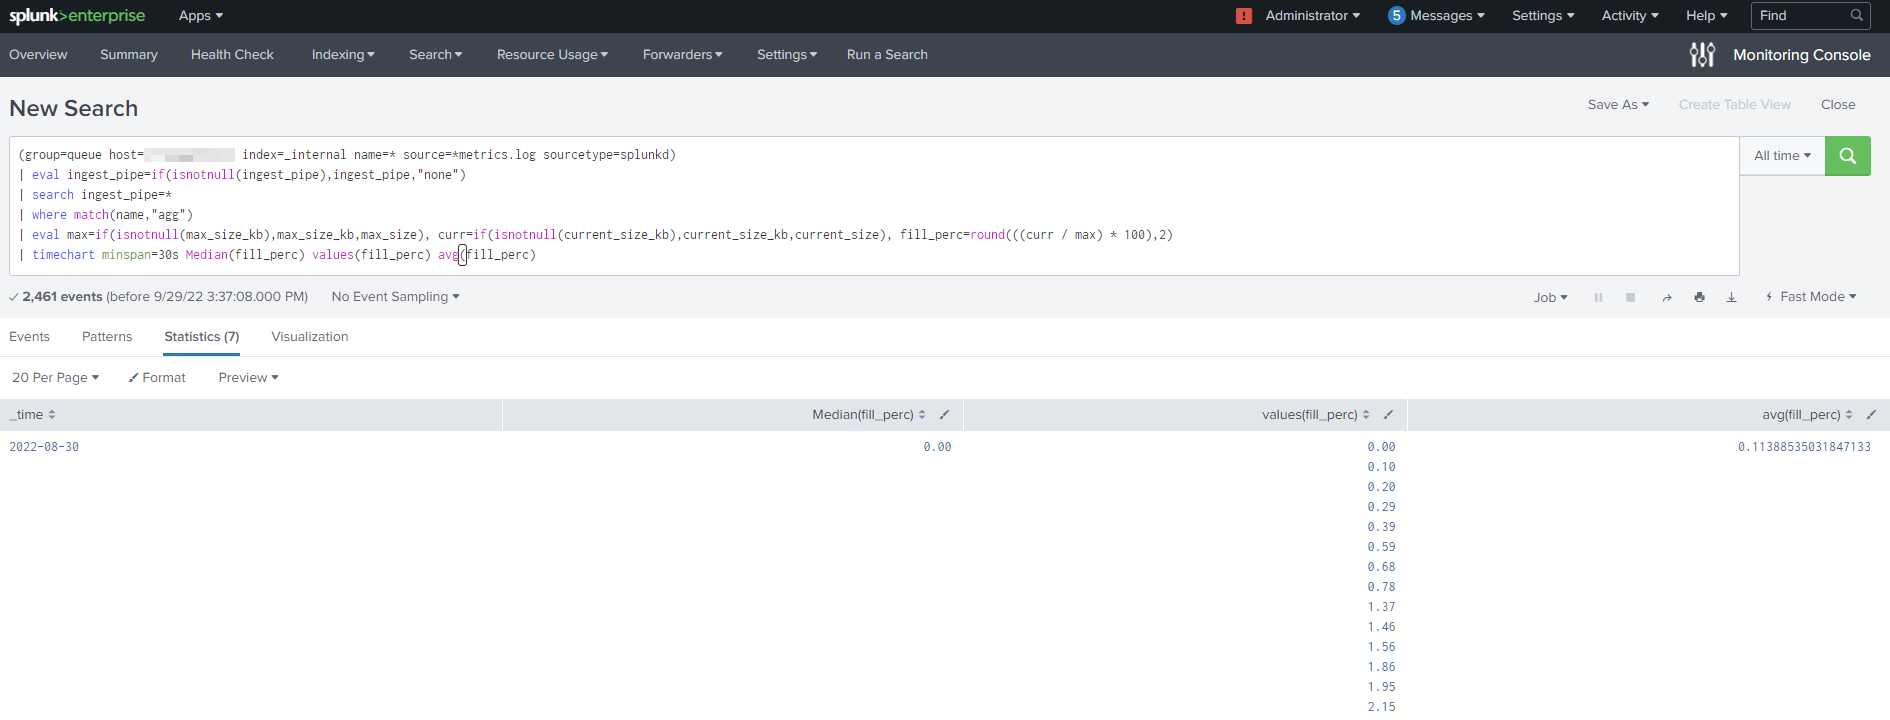
Indeed, launching the following search, over "all time" on my PC (host=localhost), I obtain that median is 0 if on values there is a 0.
In the example attached, the correct median is 0.73, instead Splunk calculate 0.
(group=queue host=localhost index=_internal name=* source=*metrics.log sourcetype=splunkd)
| eval ingest_pipe=if(isnotnull(ingest_pipe),ingest_pipe,"none")
| search ingest_pipe=*
| where match(name,"agg")
| eval max=if(isnotnull(max_size_kb),max_size_kb,max_size), curr=if(isnotnull(current_size_kb),current_size_kb,current_size), fill_perc=round(((curr / max) * 100),2)
| timechart minspan=30s Median(fill_perc) values(fill_perc) avg(fill_perc) useother=false limit=15

Anyone else found this issue ?
- Mark as New
- Bookmark Message
- Subscribe to Message
- Mute Message
- Subscribe to RSS Feed
- Permalink
- Report Inappropriate Content
It is quite possible that this is correct, given that your avg is 0.11 and you have quite a few values above that so there must be quite a few values below that to drive the mean down to 0.11
Try listing all the values to see if the median is right
| timechart minspan=30s Median(fill_perc) list(fill_perc) avg(fill_perc) useother=false limit=15You could also try counting them
- Mark as New
- Bookmark Message
- Subscribe to Message
- Mute Message
- Subscribe to RSS Feed
- Permalink
- Report Inappropriate Content
For median calculation, I considered only disinct values and not all values!
This was a wrong way to calculate
- Mark as New
- Bookmark Message
- Subscribe to Message
- Mute Message
- Subscribe to RSS Feed
- Permalink
- Report Inappropriate Content
It is quite possible that this is correct, given that your avg is 0.11 and you have quite a few values above that so there must be quite a few values below that to drive the mean down to 0.11
Try listing all the values to see if the median is right
| timechart minspan=30s Median(fill_perc) list(fill_perc) avg(fill_perc) useother=false limit=15You could also try counting them
- Mark as New
- Bookmark Message
- Subscribe to Message
- Mute Message
- Subscribe to RSS Feed
- Permalink
- Report Inappropriate Content
I concur with @ITWhisperer. Use list and you'll see all the zeros in your data set.
- Mark as New
- Bookmark Message
- Subscribe to Message
- Mute Message
- Subscribe to RSS Feed
- Permalink
- Report Inappropriate Content
your previous search until time chart command
| timechart minspan=30s values(fill_perc) as values_fill_perc avg(fill_perc)
| eventstats median(values_fill_perc) by _time
| rename values_fill_perc as "values(fill_perc)"
The eventstats command uses the multivalue field creates by the values() aggregate function and adds a new column to the table.
Warning: This will give you the Median of existent values and not the actual median over all events in the database. (see comment from @ITWhisperer )
_______________________________________
If this was helpful please consider awarding Karma. Thx!
September Community Champions: A Shoutout to Our Contributors!
Splunk Decoded: Service Maps vs Service Analyzer Tree View vs Flow Maps
What’s New in Splunk Observability – September 2025
