Join the Conversation
- Find Answers
- :
- Splunk Products
- :
- Splunk Enterprise
- :
- Re: stats median does not work with 0 value
- Subscribe to RSS Feed
- Mark Topic as New
- Mark Topic as Read
- Float this Topic for Current User
- Bookmark Topic
- Subscribe to Topic
- Mute Topic
- Printer Friendly Page
- Mark as New
- Bookmark Message
- Subscribe to Message
- Mute Message
- Subscribe to RSS Feed
- Permalink
- Report Inappropriate Content
I need to personalize the "Data Processing Queues" monitored made by Monitoring Console.
I found that "median" aggregate function, on stats or timechart commands does not work correctly.
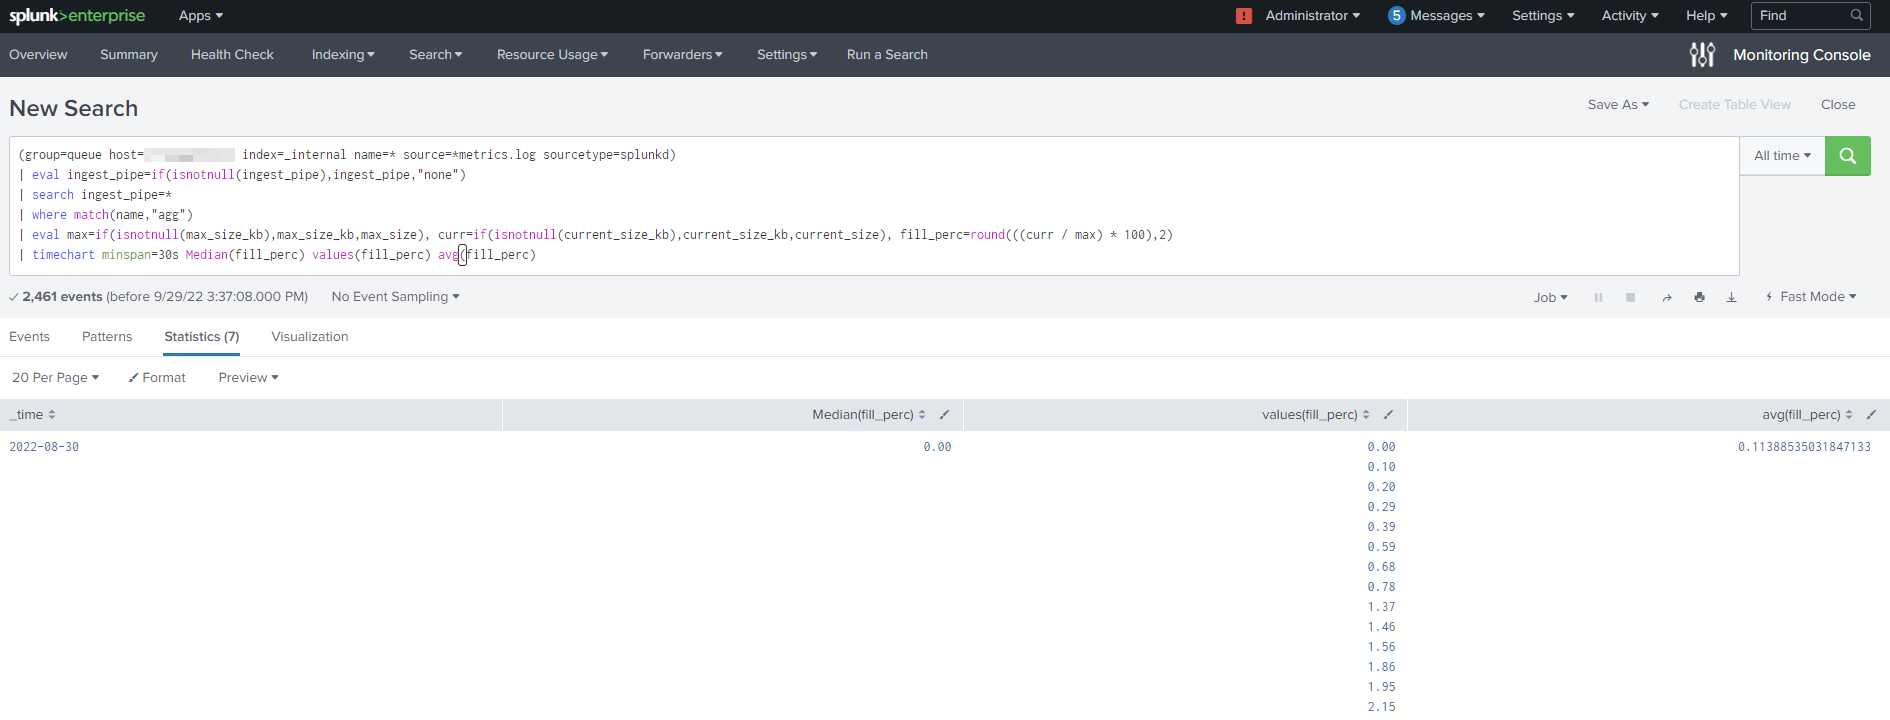
Indeed, launching the following search, over "all time" on my PC (host=localhost), I obtain that median is 0 if on values there is a 0.
In the example attached, the correct median is 0.73, instead Splunk calculate 0.
(group=queue host=localhost index=_internal name=* source=*metrics.log sourcetype=splunkd)
| eval ingest_pipe=if(isnotnull(ingest_pipe),ingest_pipe,"none")
| search ingest_pipe=*
| where match(name,"agg")
| eval max=if(isnotnull(max_size_kb),max_size_kb,max_size), curr=if(isnotnull(current_size_kb),current_size_kb,current_size), fill_perc=round(((curr / max) * 100),2)
| timechart minspan=30s Median(fill_perc) values(fill_perc) avg(fill_perc) useother=false limit=15

Anyone else found this issue ?
- Mark as New
- Bookmark Message
- Subscribe to Message
- Mute Message
- Subscribe to RSS Feed
- Permalink
- Report Inappropriate Content
It is quite possible that this is correct, given that your avg is 0.11 and you have quite a few values above that so there must be quite a few values below that to drive the mean down to 0.11
Try listing all the values to see if the median is right
| timechart minspan=30s Median(fill_perc) list(fill_perc) avg(fill_perc) useother=false limit=15You could also try counting them
- Mark as New
- Bookmark Message
- Subscribe to Message
- Mute Message
- Subscribe to RSS Feed
- Permalink
- Report Inappropriate Content
For median calculation, I considered only disinct values and not all values!
This was a wrong way to calculate
- Mark as New
- Bookmark Message
- Subscribe to Message
- Mute Message
- Subscribe to RSS Feed
- Permalink
- Report Inappropriate Content
It is quite possible that this is correct, given that your avg is 0.11 and you have quite a few values above that so there must be quite a few values below that to drive the mean down to 0.11
Try listing all the values to see if the median is right
| timechart minspan=30s Median(fill_perc) list(fill_perc) avg(fill_perc) useother=false limit=15You could also try counting them
- Mark as New
- Bookmark Message
- Subscribe to Message
- Mute Message
- Subscribe to RSS Feed
- Permalink
- Report Inappropriate Content
I concur with @ITWhisperer. Use list and you'll see all the zeros in your data set.
- Mark as New
- Bookmark Message
- Subscribe to Message
- Mute Message
- Subscribe to RSS Feed
- Permalink
- Report Inappropriate Content
your previous search until time chart command
| timechart minspan=30s values(fill_perc) as values_fill_perc avg(fill_perc)
| eventstats median(values_fill_perc) by _time
| rename values_fill_perc as "values(fill_perc)"
The eventstats command uses the multivalue field creates by the values() aggregate function and adds a new column to the table.
Warning: This will give you the Median of existent values and not the actual median over all events in the database. (see comment from @ITWhisperer )
_______________________________________
If this was helpful please consider awarding Karma. Thx!
Join the Splunk Community Slack to learn, troubleshoot, and make connections with fellow Splunk practitioners in real time!
Join Splunk User Groups to connect and learn in-person by region or remotely by topic or industry.
Index This | What travels the world but is also stuck in place?
Discover New Use Cases: Unlock Greater Value from Your Existing Splunk Data
Continue Your Journey: Join Session 2 of the Data Management and Federation Bootcamp ...
