
Join the Conversation
- Find Answers
- :
- Splunk Products
- :
- Splunk Enterprise
- :
- Re: Visualization for single value
- Subscribe to RSS Feed
- Mark Topic as New
- Mark Topic as Read
- Float this Topic for Current User
- Bookmark Topic
- Subscribe to Topic
- Mute Topic
- Printer Friendly Page
- Mark as New
- Bookmark Message
- Subscribe to Message
- Mute Message
- Subscribe to RSS Feed
- Permalink
- Report Inappropriate Content

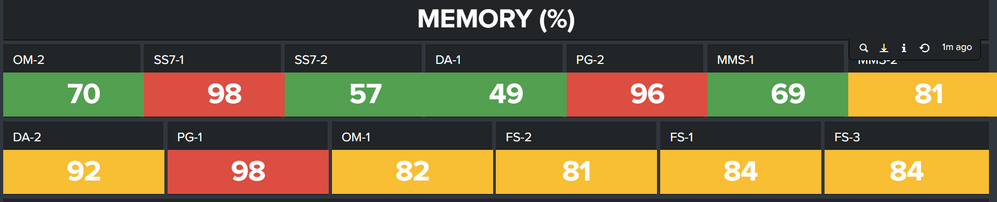
I want to make the panel and the font smaller in size. So that I can put more panel in one line with the font visible.
Does anyone know how to do this?
- Mark as New
- Bookmark Message
- Subscribe to Message
- Mute Message
- Subscribe to RSS Feed
- Permalink
- Report Inappropriate Content


- Mark as New
- Bookmark Message
- Subscribe to Message
- Mute Message
- Subscribe to RSS Feed
- Permalink
- Report Inappropriate Content
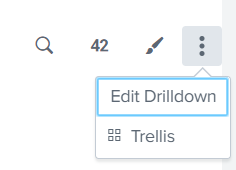
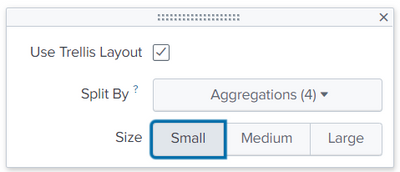
Edit trellis and set to small or have you already done this?
- Mark as New
- Bookmark Message
- Subscribe to Message
- Mute Message
- Subscribe to RSS Feed
- Permalink
- Report Inappropriate Content
Thank you so much! It works. I have 1 more question which is how can I remove the percentage which is the name of the field of the trellis.

- Mark as New
- Bookmark Message
- Subscribe to Message
- Mute Message
- Subscribe to RSS Feed
- Permalink
- Report Inappropriate Content
You would need to rename them in the search - are you able to share your search?
- Mark as New
- Bookmark Message
- Subscribe to Message
- Mute Message
- Subscribe to RSS Feed
- Permalink
- Report Inappropriate Content
source="KPG_MIO_HC_Logs_2021-11-14-10.txt" host="vm-splunk01" index="maxis_csasec_index" sourcetype="NFVInfrastructureMonitoring" "om-2 | CHANGED | rc=0 >>" OR "om-2 | FAILED | rc=0 >>"
| search total used free shared buffers cached
| multikv | eval percentage=round(used/total*100)
| where percentage NOT NULL | table percentage
This is the search query


Join the Splunk Community Slack to learn, troubleshoot, and make connections with fellow Splunk practitioners in real time!
Join Splunk User Groups to connect and learn in-person by region or remotely by topic or industry.
Supercharging Windows Security Detection Performance: Introducing Hybrid Field ...
Ditch the Manual Grind: Building AI Agents with Splunk
Cisco Data Fabric from Architecture to Investigation, Better SOC Visibility, and More ...
