
Join the Conversation
- Find Answers
- :
- Apps & Add-ons
- :
- Splunk Development
- :
- Splunk Dev
- :
- Re: Timechart - map data over same interval everyd...
- Subscribe to RSS Feed
- Mark Topic as New
- Mark Topic as Read
- Float this Topic for Current User
- Bookmark Topic
- Subscribe to Topic
- Mute Topic
- Printer Friendly Page
- Mark as New
- Bookmark Message
- Subscribe to Message
- Mute Message
- Subscribe to RSS Feed
- Permalink
- Report Inappropriate Content
Timechart - map data over same interval everyday

Hi,
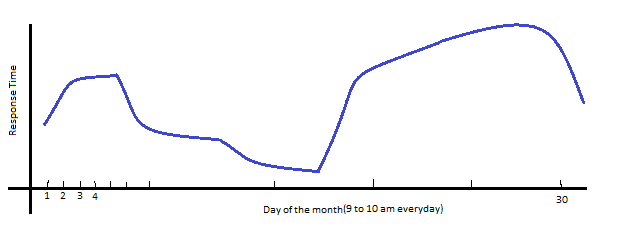
I have a requirement to timechart data over the same time everyday for the past one month.
E.g.: Maximum responseTime between 9 and 10 everyday for the past month.
Query to construct timechart is:
host=host1-vm1-dev.abp.com OR host=host2-vm1-dev.abp.com date_hour=9 | timechart max(responseTime)
How do I modify this search such that the timechart displays values only between 9 and 10 (and not the whole day) everyday?
Sample chart given below.
Thanks,
Deepak

- Mark as New
- Bookmark Message
- Subscribe to Message
- Mute Message
- Subscribe to RSS Feed
- Permalink
- Report Inappropriate Content

i see you're already limiting date_hour=9 so the data you're pulling is only from the 9AM hour (9-10 AM) every day, and not the whole day. Timechart will display the dates on the axis, not the date/hour. Timechart, also, will make the time continuous, if you don't specify a span.
|timechart span=1d max(responseTime)
will group it into one day buckets, though it won't display the hour.
- Mark as New
- Bookmark Message
- Subscribe to Message
- Mute Message
- Subscribe to RSS Feed
- Permalink
- Report Inappropriate Content
Thankyou.
I would like to display the time and value on the graph.
For instance, if the maximum duration for Oct 5 is 2214 at 09:30:51.225, I would like the data point to read (Oct 5 09:30:51 - 2214).
The idea is I want to study what is the trend of responseTime everyday. I am supposed to reduce it below 1000 ms, and I need to know how much of the transactions are taking more than 1000 ms.
- Mark as New
- Bookmark Message
- Subscribe to Message
- Mute Message
- Subscribe to RSS Feed
- Permalink
- Report Inappropriate Content
try this, instead:
host=host1-vm1-dev.abp.com OR host=host2-vm1-dev.abp.com date_hour=9
|timechart max(responseTime) span=5m cont=f
|timewrap 1d
change the span in timechart to your liking, i put it to bucket every 5 minutes.
you can remove the timewrap if you want. that'll display a line per day, which might get hard to read.
- Mark as New
- Bookmark Message
- Subscribe to Message
- Mute Message
- Subscribe to RSS Feed
- Permalink
- Report Inappropriate Content

If you really WANT the hour displayed, you could try something like this...
host=host1-vm1-dev.abp.com OR host=host2-vm1-dev.abp.com date_hour=9
| bin _time span=1h
| timechart span=1h max(responseTime) cont=f
But the axis labels in timechart are a bit unpredictable.

Join the Splunk Community Slack to learn, troubleshoot, and make connections with fellow Splunk practitioners in real time!
Join Splunk User Groups to connect and learn in-person by region or remotely by topic or industry.
Data Outage Monitoring and Reporting
Manage Datasets and Connections in Catalog on Splunk Cloud Platform
Persistent Queue at TcpOut — One of Splunk's Most Practical Features
