
Join the Conversation
- Find Answers
- :
- Apps & Add-ons
- :
- Splunk Development
- :
- Splunk Dev
- :
- Re: Splunk Bar Chart Colors
- Subscribe to RSS Feed
- Mark Topic as New
- Mark Topic as Read
- Float this Topic for Current User
- Bookmark Topic
- Subscribe to Topic
- Mute Topic
- Printer Friendly Page
- Mark as New
- Bookmark Message
- Subscribe to Message
- Mute Message
- Subscribe to RSS Feed
- Permalink
- Report Inappropriate Content

Hi I am fairly new to Splunk , thank you in advance if you can help me...:)
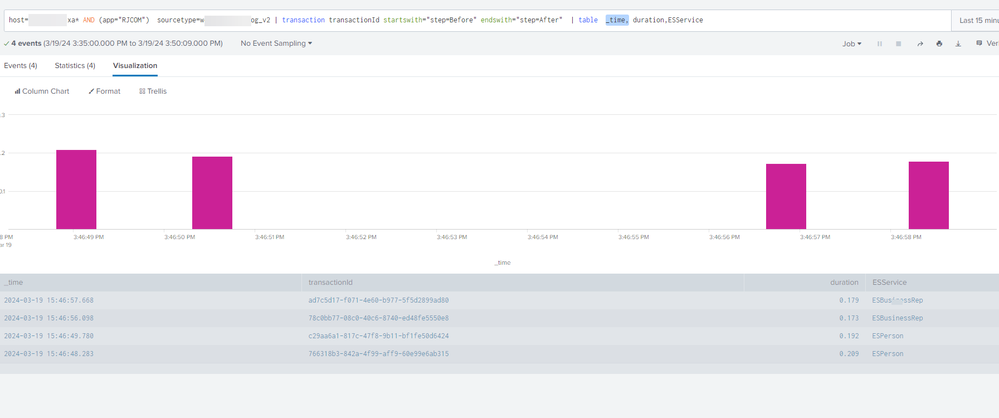
My goal is to log the service response duration each time a ESService is called. The ESService value can be anything. In the table format below I am able to see which service is being hit and the duration .
But in the visualization section, all the events showing the same color, Is there anyway to show different color for each ESService . For example , when ESBusinessrep blue, for ESPerson red etc.(dynamically there can be N number of service types). And when I hover on the bars they are showing time, and duration values only not the ESService. How to achieve this?
- Mark as New
- Bookmark Message
- Subscribe to Message
- Mute Message
- Subscribe to RSS Feed
- Permalink
- Report Inappropriate Content


A bar chart will give you a different colour for each series, so you would need to do something like
| chart max(duration) over _time by ESService
- Mark as New
- Bookmark Message
- Subscribe to Message
- Mute Message
- Subscribe to RSS Feed
- Permalink
- Report Inappropriate Content
A bar chart will give you a different colour for each series, so you would need to do something like
| chart max(duration) over _time by ESService
- Mark as New
- Bookmark Message
- Subscribe to Message
- Mute Message
- Subscribe to RSS Feed
- Permalink
- Report Inappropriate Content
Thank you bowesmana!.
Really appreciate your help on this.
now I am greedy....
Can I get query to get Max, Average, Minimum of each ESService?
- Mark as New
- Bookmark Message
- Subscribe to Message
- Mute Message
- Subscribe to RSS Feed
- Permalink
- Report Inappropriate Content
transaction transactionId startswith="step=Before" endswith="step=After" | stats max(duration) as MaxRespTime avg(duration) as AvgRespTime min(duration) as MinRespTime by ESServiceThis should do it .


Join the Splunk Community Slack to learn, troubleshoot, and make connections with fellow Splunk practitioners in real time!
Join Splunk User Groups to connect and learn in-person by region or remotely by topic or industry.
Meet Splunk Observability Studio: AI-Assisted OpenTelemetry Instrumentation Without ...
Federated Search for Cisco Security and Analytics Logging (SAL) is now GA on Splunk ...
Your Path to AgenticOps: AI Experiences for Every Splunk Practitioner
