
Join the Conversation
- Find Answers
- :
- Splunk Products
- :
- Splunk Cloud Platform
- :
- Re: Incorrect Timestamp from log
- Subscribe to RSS Feed
- Mark Topic as New
- Mark Topic as Read
- Float this Topic for Current User
- Bookmark Topic
- Subscribe to Topic
- Mute Topic
- Printer Friendly Page
- Mark as New
- Bookmark Message
- Subscribe to Message
- Mute Message
- Subscribe to RSS Feed
- Permalink
- Report Inappropriate Content
Why is there incorrect Timestamp from log?

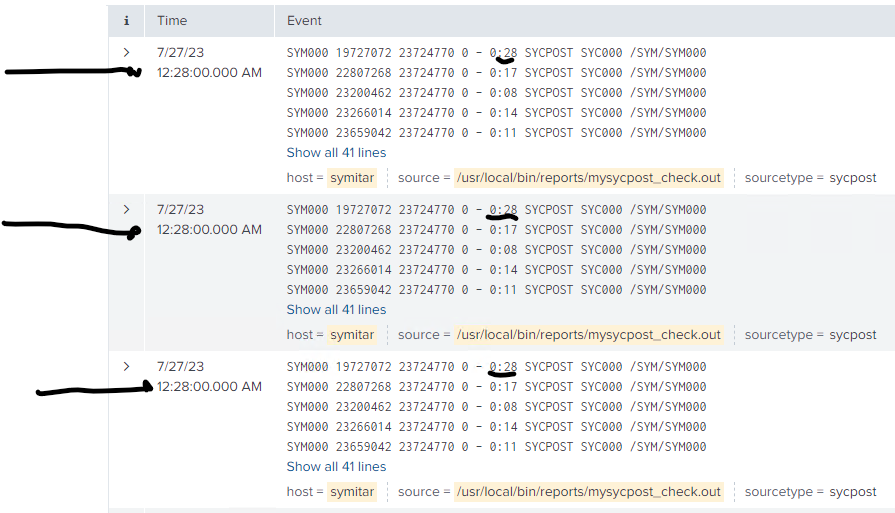
I have an On-Prem deployment Server and an AIX Server with a UF. I have a log monitor that redirects and overwrites an out file every minute. example:
-rw-r--r-- 1 root system 27804 Jul 27 17:32 /usr/local/bin/reports/mysycpost_check.out
-rw-r--r-- 1 root system 27804 Jul 27 17:33 /usr/local/bin/reports/mysycpost_check.out
-rw-r--r-- 1 root system 27804 Jul 27 17:34 /usr/local/bin/reports/mysycpost_check.out
The contents of this file contains 41 lines every time its overwritten but contain different values each time:
SYM000 19727072 23724770 0 - 0:28 SYCPOST SYC000 /SYM/SYM000
SYM000 22807268 23724770 0 - 0:17 SYCPOST SYC000 /SYM/SYM000
SYM000 23200462 23724770 0 - 0:08 SYCPOST SYC000 /SYM/SYM000
SYM000 23266014 23724770 0 - 0:14 SYCPOST SYC000 /SYM/SYM000
SYM000 23659042 23724770 0 - 0:11 SYCPOST SYC000 /SYM/SYM000
SYM000 23855850 23724770 0 - 0:35 SYCPOST SYC000 /SYM/SYM000
SYM000 24576546 23724770 0 - 0:43 SYCPOST SYC000 /SYM/SYM000
SYM000 24838656 23724770 0 - 0:06 SYCPOST SYC000 /SYM/SYM000
SYM000 24904198 23724770 0 - 0:09 SYCPOST SYC000 /SYM/SYM000
SYM000 24969758 23724770 0 - 0:22 SYCPOST SYC000 /SYM/SYM000
SYM000 25035266 23724770 0 - 0:56 SYCPOST SYC000 /SYM/SYM000
SYM000 25100802 23724770 0 - 0:06 SYCPOST SYC000 /SYM/SYM000
SYM000 25166340 23724770 0 - 0:05 SYCPOST SYC000 /SYM/SYM000
SYM000 25231878 23724770 0 - 0:04 SYCPOST SYC000 /SYM/SYM000
SYM000 25362954 23724770 0 - 0:04 SYCPOST SYC000 /SYM/SYM000
SYM000 25428492 23724770 0 - 0:03 SYCPOST SYC000 /SYM/SYM000
SYM000 25494030 23724770 0 - 0:03 SYCPOST SYC000 /SYM/SYM000
(41 lines)
As of right now the timestamp is coming from the value: "0:28 " at the top of the file which makes it 12:28am. So all my events are using this value for time. This is incorrect. I want the file to be one event and get the timestamp of the actual time of the log when its written:
Jul 27 17:32
Jul 27 17:33
Jul 27 17:34 and so on....
Here is the inputs .conf and my props.conf (which is side by side on my Deplyment Server:
/opt/splunk/etc/deployment-apps/cu-infrastructure-xxx/local
[root@deployment_server local]# ll
total 12
-rw-------. 1 splunk splunk 21 Dec 30 2020 app.conf
-rw-rw-r--. 1 splunk splunk 1326 Jul 27 14:20 inputs.conf
-rw-r--r--. 1 splunk splunk 115 Jul 27 16:16 props.conf
Props.conf
[sycpost]
DATETIME_CONFIG=CURRENT
SHOULD_LINEMERGE=false
LINE_BREAKER=([\r\n]+)
NO_BINARY_CHECK=true
CHARSET=UTF-8
Inputs.conf
### symitar SYCPOST utilization logs
[monitor:///usr/local/bin/reports/mysycpost_check.out]
disabled = false
index = cu-infrastructure-xxx
sourcetype = sycpost
Question is Do I have my Props.conf in the right location? Deployment Server? Does it need to by on my Cloud indexers? IS the Props correct? IM trying to have the log determine the time of the event.
- Mark as New
- Bookmark Message
- Subscribe to Message
- Mute Message
- Subscribe to RSS Feed
- Permalink
- Report Inappropriate Content


Those look like the right props, but they won't do any good on the DS. Put them on your indexers or (if you have them) heavy forwarders.
If this reply helps you, Karma would be appreciated.
- Mark as New
- Bookmark Message
- Subscribe to Message
- Mute Message
- Subscribe to RSS Feed
- Permalink
- Report Inappropriate Content
thank you for the reply!


Join the Splunk Community Slack to learn, troubleshoot, and make connections with fellow Splunk practitioners in real time!
Join Splunk User Groups to connect and learn in-person by region or remotely by topic or industry.
Thanks for the Memories: .conf26 Took Learning to New Heights
Best Practices: Splunk auto adjust pipeline queue
Splunk Auto Ingestion Parallel Pipeline Scaling
