
Join the Conversation
- Find Answers
- :
- Using Splunk
- :
- Other Using Splunk
- :
- Reporting
- :
- Re: How to use pivot (unpivot) command
- Subscribe to RSS Feed
- Mark Topic as New
- Mark Topic as Read
- Float this Topic for Current User
- Bookmark Topic
- Subscribe to Topic
- Mute Topic
- Printer Friendly Page
- Mark as New
- Bookmark Message
- Subscribe to Message
- Mute Message
- Subscribe to RSS Feed
- Permalink
- Report Inappropriate Content

Hi all!
I have a table like this:
ServerName Metric1 Metric2

Server1    1       0
Server2    1       1
Server3    1       1
Server4    0       1
And i need a table like this:
Column   Rows     Count

Metric1  Server1  1
Metric2  Server1  0
Metric1  Server2  1
Metric2  Server2  1
Metric1  Server3  1
Metric2  Server3  1
Metric1  Server4  0
Metric2  Server4  1
This was the simple case.
The difficult case is:
i need a table like this:
Column   Rows      Col_type  Parent_col Count

Metric1  Server1   Sub       Metric3    1
Metric2  Server1   Sub       Metric3    0
Metric3  Server1                        (Metric1+Metric2)
Metric1  Server2   Sub       Metric3    1
Metric2  Server2   Sub       Metric3    1
Metric3  Server2                        (Metric1+Metric2)
Metric1  Server3   Sub       Metric3    1
Metric2  Server3   Sub       Metric3    1
Metric3  Server3                        (Metric1+Metric2)
Metric1  Server4   Sub       Metric3    0
Metric2  Server4   Sub       Metric3    1
Metric3  Server4                        (Metric1+Metric2)
Thanks all!
- Mark as New
- Bookmark Message
- Subscribe to Message
- Mute Message
- Subscribe to RSS Feed
- Permalink
- Report Inappropriate Content

I have replicated your sample table with a csv and developed the following, which I understand it's exactly what you are looking for based on your description:
| inputcsv mycsv.csv
| untable ServerName Metrics Count
| rename Metrics as Column, ServerName as Rows
| sort -limit=0 Rows, Column
| eval Col_type = "Sub"
| appendpipe [ | stats sum(Count) as Count by Rows | eval Column = "Metric3" ]
| sort -limit=0 Rows, Column
| eventstats last(Column) as Parent_col by Rows
| eval Parent_col = if (Col_type = "Sub", Parent_col, null())
| table Column, Rows, Col_type, Parent_col, Count
Output (see picture below):
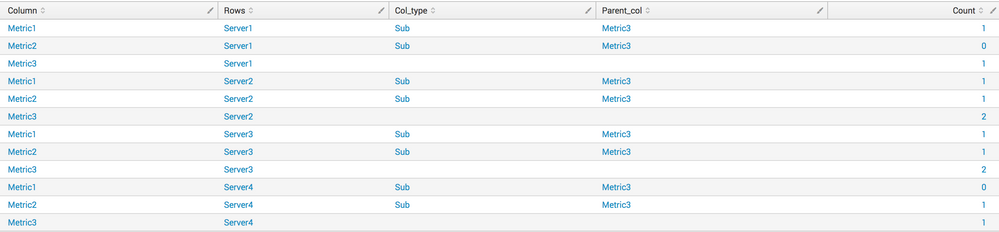
And this is the CSV I used:
ServerName,Metric1,Metric2
Server1,1,0
Server2,1,1
Server3,1,1
Server4,0,1
Thanks,
J
- Mark as New
- Bookmark Message
- Subscribe to Message
- Mute Message
- Subscribe to RSS Feed
- Permalink
- Report Inappropriate Content
I have replicated your sample table with a csv and developed the following, which I understand it's exactly what you are looking for based on your description:
| inputcsv mycsv.csv
| untable ServerName Metrics Count
| rename Metrics as Column, ServerName as Rows
| sort -limit=0 Rows, Column
| eval Col_type = "Sub"
| appendpipe [ | stats sum(Count) as Count by Rows | eval Column = "Metric3" ]
| sort -limit=0 Rows, Column
| eventstats last(Column) as Parent_col by Rows
| eval Parent_col = if (Col_type = "Sub", Parent_col, null())
| table Column, Rows, Col_type, Parent_col, Count
Output (see picture below):
And this is the CSV I used:
ServerName,Metric1,Metric2
Server1,1,0
Server2,1,1
Server3,1,1
Server4,0,1
Thanks,
J
- Mark as New
- Bookmark Message
- Subscribe to Message
- Mute Message
- Subscribe to RSS Feed
- Permalink
- Report Inappropriate Content
Simply perfect!
Thank you!
- Mark as New
- Bookmark Message
- Subscribe to Message
- Mute Message
- Subscribe to RSS Feed
- Permalink
- Report Inappropriate Content

The community can best help you if you share some of the SPL commands you are using to generate the tables. For example, are you actually using pivot for this? Please share as much as possible.




Join the Splunk Community Slack to learn, troubleshoot, and make connections with fellow Splunk practitioners in real time!
Join Splunk User Groups to connect and learn in-person by region or remotely by topic or industry.
Cisco Data Fabric from Architecture to Investigation, Better SOC Visibility, and More ...
The Trust Gap: Why a Data Foundation is Fundamental to an Agentic Enterprise
Data Management Digest – September 2026
