
Join the Conversation
- Find Answers
- :
- Splunk Administration
- :
- Monitoring Splunk
- :
- Re: Perfmon stanza
- Subscribe to RSS Feed
- Mark Topic as New
- Mark Topic as Read
- Float this Topic for Current User
- Bookmark Topic
- Subscribe to Topic
- Mute Topic
- Printer Friendly Page
- Mark as New
- Bookmark Message
- Subscribe to Message
- Mute Message
- Subscribe to RSS Feed
- Permalink
- Report Inappropriate Content
Perfmon stanza

Hi,
we are trying to on board some windows perfmon counters. We can do LogicalDisk, Memory, Network Interface, PhysicalDisk, Process, Processor information, Processor, server.
However we cannot pick up the following. I asked our windows admin to confirm they exist on the servers. I can't find any correct stanza definitions for each type, but below is what we are currently using (for the ones not working)
APP_POOL_WAS
[perfmon://APP_POOL_WAS]
counters = *
instances = *
disabled = 0
interval = 30
mode = multikv
object = *
useEnglishOnly=true
index = windows_perfmon
ASP.NET Applications
[perfmon://ASP.NET_Applications]
counters = *
instances = *
disabled = 0
interval = 30
mode = multikv
object = *
useEnglishOnly=true
index = windows_perfmon
ASP.NET
[perfmon://ASP.NET]
counters = *
instances = *
disabled = 0
interval = 30
mode = multikv
object = *
useEnglishOnly=true
index = windows_perfmon
Cache
[perfmon://Cache]
counters = *
instances = *
disabled = 0
interval = 30
mode = multikv
object = *
useEnglishOnly=true
index = windows_perfmon
HTTP Service Request Queues
[perfmon://HTTP_Service_Request_Queues]
counters = *
instances = *
disabled = 0
interval = 30
mode = multikv
object = *
useEnglishOnly=true
index = windows_perfmon
Paging File
[perfmon://Paging_File]
counters = *
instances = *
disabled = 0
interval = 30
mode = multikv
object = *
useEnglishOnly=true
index = windows_perfmon
W3SVC_W3WP
[perfmon://W3SVC_W3WP]
counters = *
instances = *
disabled = 0
interval = 30
mode = multikv
object = *
useEnglishOnly=true
index = windows_perfmon
WAS_W3WP
[perfmon://WAS_W3WP]
counters = *
instances = *
disabled = 0
interval = 30
mode = multikv
object = *
useEnglishOnly=true
index = windows_perfmon
Web Service
[perfmon://Web_Service]
counters = *
instances = _Total
disabled = 0
interval = 30
mode = multikv
object = *
useEnglishOnly=true
index = windows_perfmon
- Mark as New
- Bookmark Message
- Subscribe to Message
- Mute Message
- Subscribe to RSS Feed
- Permalink
- Report Inappropriate Content

You can find all of them if you have a full Splunk instance installed on a windows server
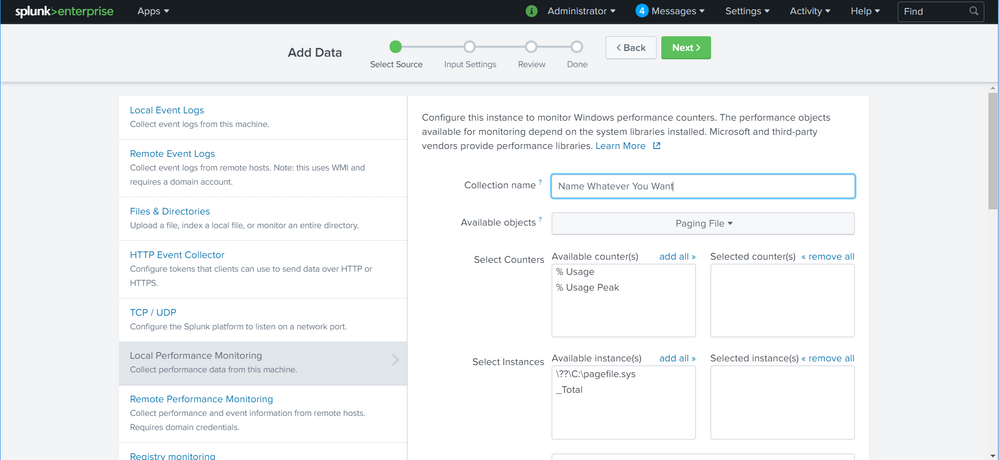
navigate to "Settings" (top right) -> click: "Data Inputs" -> click "Local Performance Monitoring" -> click: "New Local Performance -Monitoring" -> use the drop down to pick up the relevant object -> add counters -> add instances -> select and continue with the wizard.
see attached screen shot:
here is teh stanza for the WEB perfmon data:
  [perfmon://WEB]
    counters = xxxxxx
    index = perfmon
    instances = Default Web Site;_Total
    interval = 30
    object = Web Service
    disabled = 1
note, there were too many counters that i enabled to put in this box
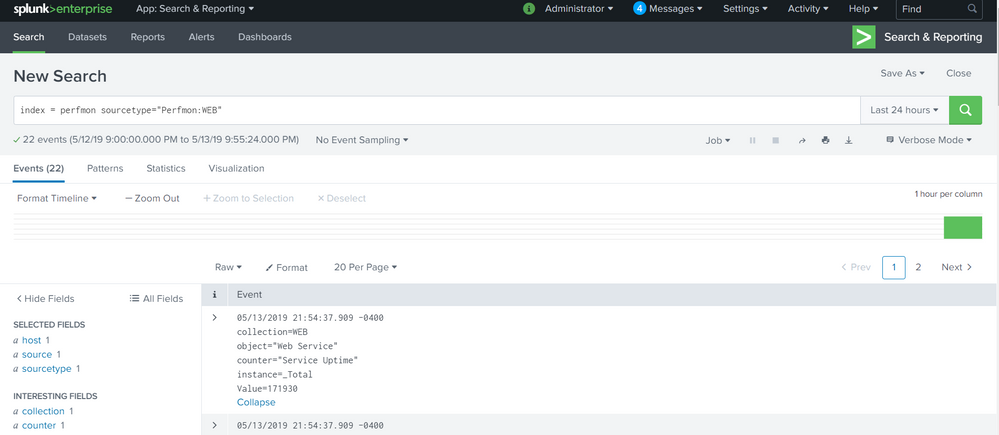
here is a screen shot of the web perfmon data:
hope it helps
- Mark as New
- Bookmark Message
- Subscribe to Message
- Mute Message
- Subscribe to RSS Feed
- Permalink
- Report Inappropriate Content
copy/paste missed off the wild cards after =
counters = *
instances = *
object = *




Join the Splunk Community Slack to learn, troubleshoot, and make connections with fellow Splunk practitioners in real time!
Join Splunk User Groups to connect and learn in-person by region or remotely by topic or industry.
Agentic Operations Start with Context: Build the Right Data Foundation
Assisted, Augmented or Agentic? Choose Your Splunk Starting Point
Session 2 | Beyond the Thread: Operationalizing AI with Confidence
