
Join the Conversation
- Find Answers
- :
- Splunk Administration
- :
- Monitoring Splunk
- :
- Looking at Queue Fill ratios in DMC - which aggreg...
- Subscribe to RSS Feed
- Mark Topic as New
- Mark Topic as Read
- Float this Topic for Current User
- Bookmark Topic
- Subscribe to Topic
- Mute Topic
- Printer Friendly Page
- Mark as New
- Bookmark Message
- Subscribe to Message
- Mute Message
- Subscribe to RSS Feed
- Permalink
- Report Inappropriate Content
Looking at Queue Fill ratios in DMC - which aggregation?

What's the general consensus / best practice when looking in the DMC --> Indexing --> Indexing Performance: Instance, looking at the "Fill Ratio of Data Processing Queues" - Which aggregation is the "best" to use? I don't get alerts about any queues being filled.
Using the default of 'median', everything looks great, all flat-lined.
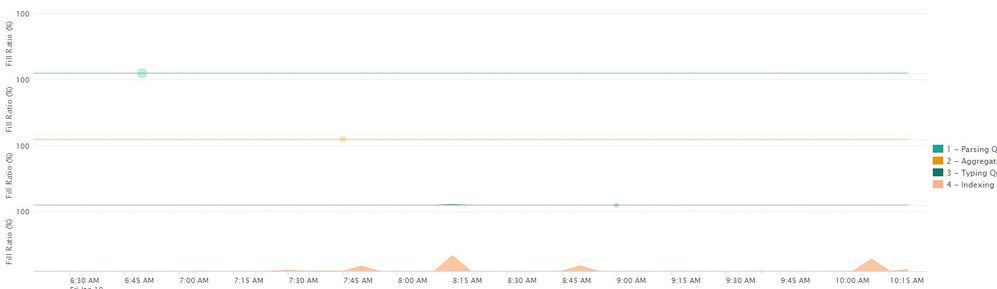
Using 90th Percentile (as suggested from my first call to support), I can see a few blips on the indexing queue, but nothing major:
Using "Maximum", there DEFINITELY appears to be an issue:
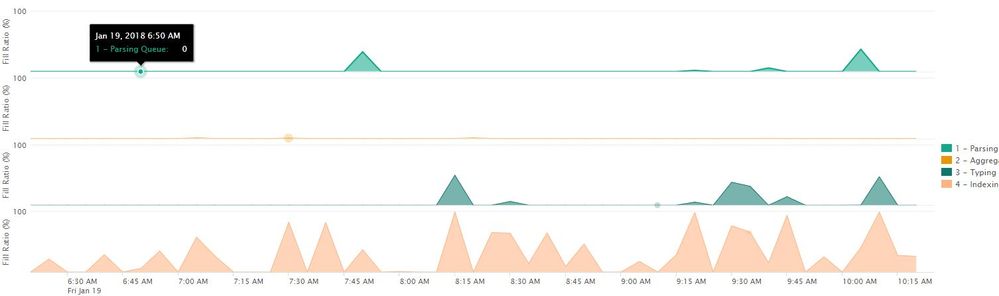
I am looking into potential SAN issues, but these are running on a lightly loaded host, fiber-channel connected to an EMC "XtremeIO" all-flash array. I can't imagine there's really an IOPS problem, but it could be something on the host/guest. We don't have any TCP/syslog going out from the indexers - it's just write to disk. But anyway, this is more about which view is 'best' to use...
- Mark as New
- Bookmark Message
- Subscribe to Message
- Mute Message
- Subscribe to RSS Feed
- Permalink
- Report Inappropriate Content

There is no general consensus / best practice on what to use, it depends on what you want to find out. To choose the aggregation properly, you need to understand what it means. Actually, it is just pure maths.
Splunk has fill ratio values on per minute basis (or maybe per every few seconds, I am not sure about that), however the graph presents them aggregated. That means several values in Splunk logs (all values in certain time window, that means per 5min, per 1h, per 1d, ...) are aggregated into one single value presented to user in graph.
In another words, if you choose to display maximum, you will get the upper limit: you know the queue fill ratio did not exceed this value during the respective timeframe. It could be useful, let's say, to prove your hardware is such an overkill that your queues can never ever get full.
To check you have no I/O trouble, average/median/90percentile are much more appropriate.
- Mark as New
- Bookmark Message
- Subscribe to Message
- Mute Message
- Subscribe to RSS Feed
- Permalink
- Report Inappropriate Content

90th percentile is what I usually use. Max is pretty misleading




Join the Splunk Community Slack to learn, troubleshoot, and make connections with fellow Splunk practitioners in real time!
Join Splunk User Groups to connect and learn in-person by region or remotely by topic or industry.
Announcing Modern Navigation: A New Era of Splunk User Experience
SOC4Kafka - New Kafka Connector Powered by OpenTelemetry
Rounding off the Splunk Dashboard Contest
