
Join the Conversation
- Find Answers
- :
- Splunk Administration
- :
- Monitoring Splunk
- :
- Re: Garbage collector graph for heap usage
- Subscribe to RSS Feed
- Mark Topic as New
- Mark Topic as Read
- Float this Topic for Current User
- Bookmark Topic
- Subscribe to Topic
- Mute Topic
- Printer Friendly Page
- Mark as New
- Bookmark Message
- Subscribe to Message
- Mute Message
- Subscribe to RSS Feed
- Permalink
- Report Inappropriate Content
Garbage collector graph for heap usage

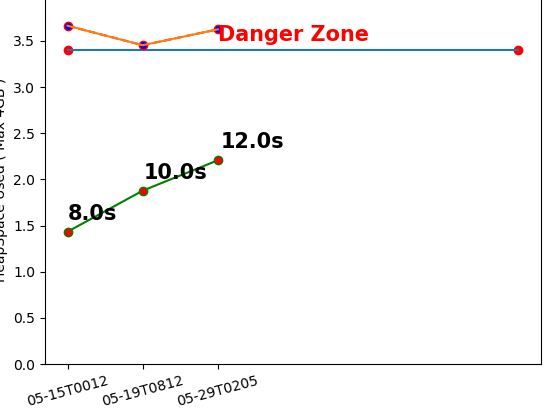
I am trying to create a dashboard for Heap analysis. There I would like to plot a line graph with a time taken for Full gc. So I extracted 3 feilds 1.Afg: memory after full Gc 2. Memory Before Full Gc 3. Tfg: time taken for full Gc. My data looks like this
_time Bfg (in bytes) Afg((iin bytes) Tfg in Sec
2018-06-05T01:41:59.882-0700 3827336 2714566 13.974176
2018-06-05T14:12:27.501-0700 3464646 2852415 14.039128
2018-05-25T01:32:57.757-0700 3802706 2080387 10.89727
2018-05-15T10:20:43.301-0700 3400723 1793472 9.449684
2018-05-17T02:36:08.789-0700 2946767 1731755 9.05516
I wanted to plot line graph for BFG and AFG and show the Tfg values on the Afg line at the corresponding values.
Please find the attached line graph for reference.
Can some one help me with the SPL?
- Mark as New
- Bookmark Message
- Subscribe to Message
- Mute Message
- Subscribe to RSS Feed
- Permalink
- Report Inappropriate Content

Hi,
You will need to tweak things a little for the scale issue on the y axis. Divide your bytes by 10 ^6 to convert them to GB first, if that is acceptable try something like this |
eval bfg_gb= round(Bfg (in bytes)/1000000,1) |eval afg_gb= round(afg (in bytes)/1000000,1)|eval tfg=round(tfg,1)| chart values(bfg_gb),values(afg_gb),values(tfg) by _time
Check the output, is this similar to what you need?
- Mark as New
- Bookmark Message
- Subscribe to Message
- Mute Message
- Subscribe to RSS Feed
- Permalink
- Report Inappropriate Content
Awesome that works
- Mark as New
- Bookmark Message
- Subscribe to Message
- Mute Message
- Subscribe to RSS Feed
- Permalink
- Report Inappropriate Content
hi @kmahamkali , if the answer is satisfactory, please accept the answer
- Mark as New
- Bookmark Message
- Subscribe to Message
- Mute Message
- Subscribe to RSS Feed
- Permalink
- Report Inappropriate Content
Any recommendations?



Join the Splunk Community Slack to learn, troubleshoot, and make connections with fellow Splunk practitioners in real time!
Join Splunk User Groups to connect and learn in-person by region or remotely by topic or industry.
Mastering Threat Intelligence in ES 8.5, Splunk AI Assistant v2, and More from Splunk ...
Break the Build: Inside the KubeDoom Lounge at .conf26
Splunk Auto Ingestion Parallel Pipeline Scaling
